2025 was another strong year for US markets, with the major indexes delivering solid gains amid a resilient economy and ongoing AI momentum.
The Fed implemented rate cuts, while precious metals stole the show as standout performers.
Macro
GDP
The U.S. economy started 2025 on a volatile note,
contracting at an annualized rate of 0.5% in the first quarter1 amid a surge in imports as businesses stockpiled goods in anticipation of escalating tariff pressures.
As trade tensions eased and import volumes normalized, resilient consumer spending fueled a robust rebound, with real GDP accelerating to 3.8% annualized growth in the second quarter.
Momentum built further in the third quarter, where the economy
expanded at a strong 4.4% pace2 –
the fastest in two years3 –
propelled by solid gains in consumer spending, exports, government spending, and investment, and a decline in imports.
Looking ahead,
the Federal Reserve Bank of Atlanta's GDPNow model currently estimates4 real GDP growth at a robust 5.2% annualized rate for the fourth quarter.
Federal Reserve Policy
The Federal Reserve maintained its federal funds target range at 4.25%–4.50% through much of 2025 before changing course in response to softening labor-market data.
This prompted three consecutive 25-basis-point rate cuts at the September, October, and December FOMC meetings, bringing the target range down to 3.50%–3.75% – the lowest level since late 2022.
The December 2025 FOMC decision passed on a 9-3 vote5, marking the most dissents in a single meeting since September 2019 and highlighting deepening divisions within the committee.
Governor Stephen Miran dissented in favor of a more aggressive 50-basis-point reduction, while Chicago Fed President Austan Goolsbee and Kansas City Fed President Jeffrey Schmid voted to hold rates unchanged,
citing concerns over persistent inflation and the need for more data. In his post-meeting press conference,
Chair Jerome Powell characterized the current policy stance6 as now being "within a range of plausible estimates of neutral".
Looking ahead to 2026, market expectations via the CME FedWatch Tool point to a measured pace of easing, with most scenarios pricing in
one to three quarter-point cuts7 over the year,
though the
median outlook leans toward one or two8.
As the labor market continues to soften and inflation trends gradually toward target, the Fed's path in 2026 will remain highly data-dependent, with divisions over the appropriate pace and scale of any further easing set to be a defining theme.
Inflation
Headline CPI increased 2.7% year-over-year in December9, in line with economist consensus and unchanged from November’s level,
capping the year in which inflation remained contained at or below 3%, representing meaningful cooling from the elevated post-pandemic peaks, though still above the Federal Reserve’s preferred long-run objective of 2%.
Core CPI registered 2.6% year-over-year – softer than the expected 2.7% and flat relative to the prior month.
Manufacturing
The ISM Manufacturing PMI indicated continued contraction in the U.S. manufacturing sector10 throughout most of 2025,
with readings consistently remaining below the 50 threshold. The index closed the year at a 14-month low of 47.9 in December, marking the 10th consecutive month of contraction.
Sub-indexes revealed persistent challenges, new orders remained weak, registering at 47.7 in December, nearly unchanged from prior months, employment continued to contract, ranging between 44 and 46, with December at 44.9,
while prices stayed elevated, hovering around 58 in the final months, reflecting input cost pressures, largely driven by tariffs.
ISM Manufacturing Business Survey Committee Chair Susan Spence noted widespread slowdowns, with respondents pointing to tariff impacts, resource absorption from AI and data center buildouts, and a cautious demand outlook.
Despite these manufacturing difficulties, the broader U.S. economy continued to expand, with the PMI remaining well above the 42.3 level historically associated with GDP growth.
Labor Market
The December 2025 jobs report from the Bureau of Labor Statistics highlighted a slowdown in hiring as the year closed, with
nonfarm payrolls rising by just 50,00011 –
well below the
median economists' forecast of around 70,00012 and signaling continued labor-market cooling.
This weakness was amplified by downward revisions to prior months, October's previously reported decline was deepened to –173,000 (from –105,000),
and November's gain was trimmed to 56,000 (from 64,000), wiping out a combined 76,000 jobs from earlier estimates.
For the full year,
total nonfarm payroll employment grew by only 584,00013 – averaging 49,000 jobs per month
– marking the weakest annual hiring performance outside of a recession since 2003 and a sharp deceleration from the roughly 2 million jobs added in 2024 – averaging 168,000 monthly.
The unemployment rate throughout the year exhibited gradual upward pressure amid the hiring slowdown and disruptions from the federal government shutdown, it hovered around 4.2%–4.3% in the first half of the year, and rose to 4.4% at the end of the year.
Overall, the data points to a resilient yet weakening labor market, which is now
considered the key factor14 influencing the Federal Reserve's approach to monetary policy easing throughout 2026.
Markets
Fixed Income
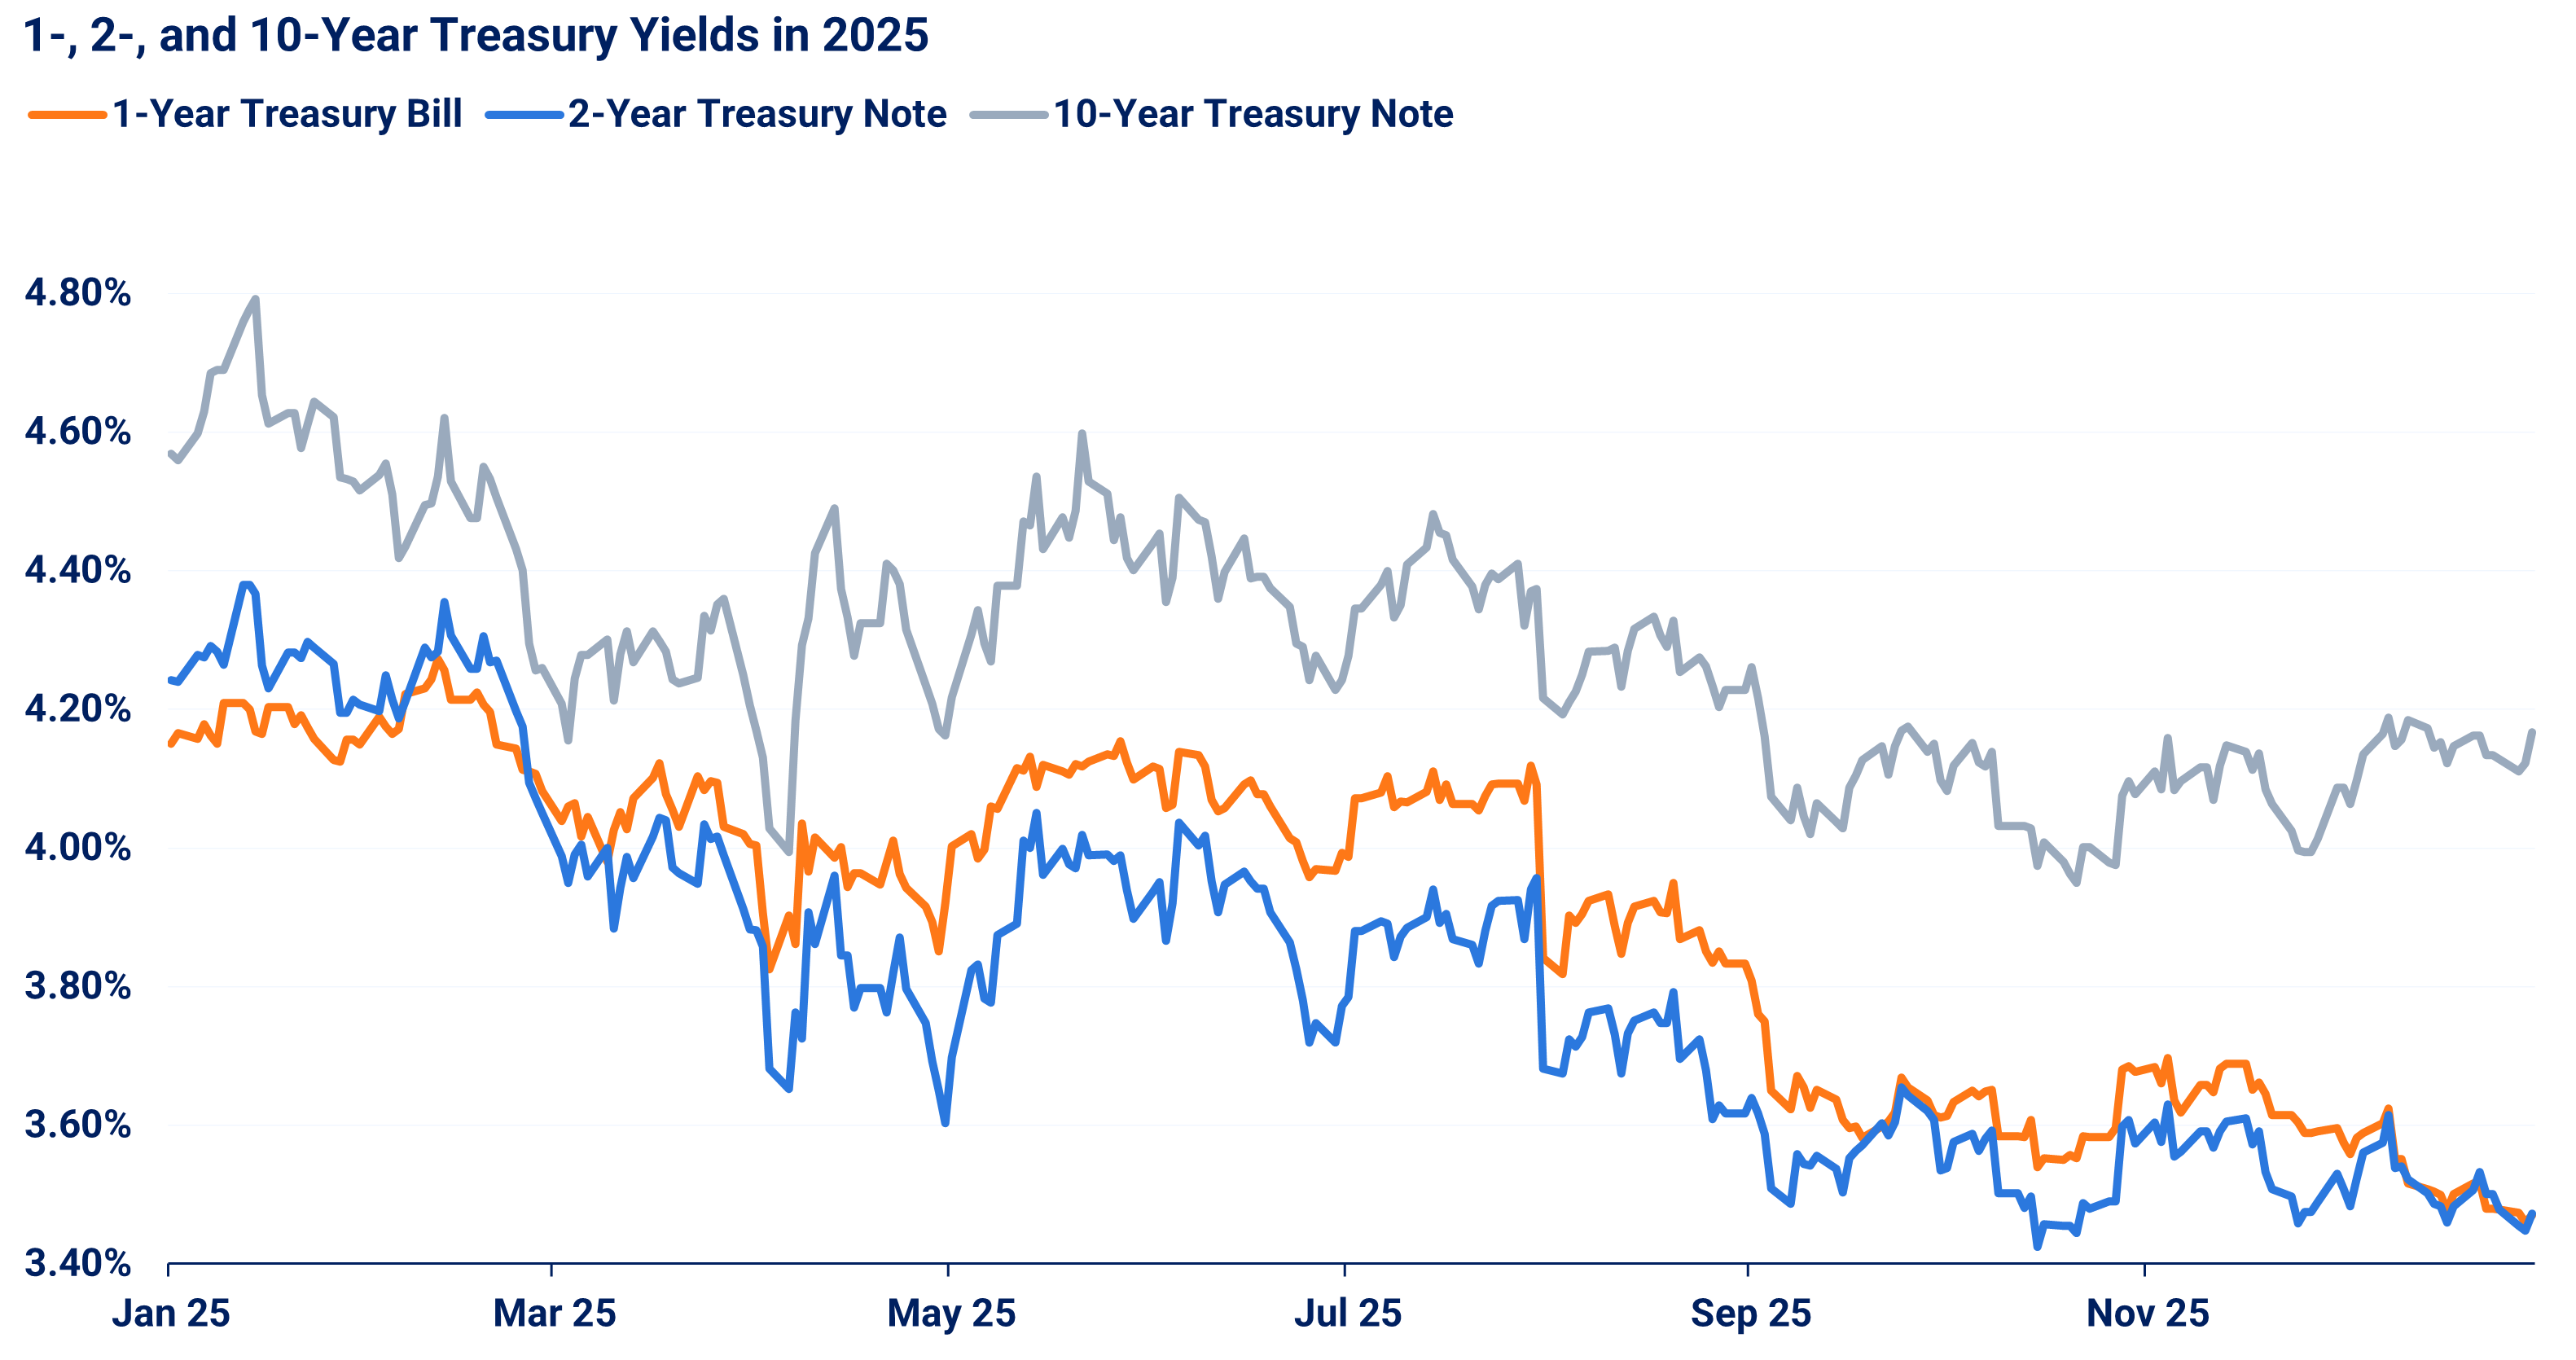
Sustained demand for U.S. government debt pushed treasury yields lower in 202515,
while the Federal Reserve's three rate cuts exerted additional downward pressure, particularly on short-term yields.
Source: Bloomberg
The 1-year treasury yield dropped 67 bps to 3.47%, the two-year shed 77 bps to the same 3.47%, the 10-year yield declined around 40 bps this year, for the latter two the drop was their highest since 2020.
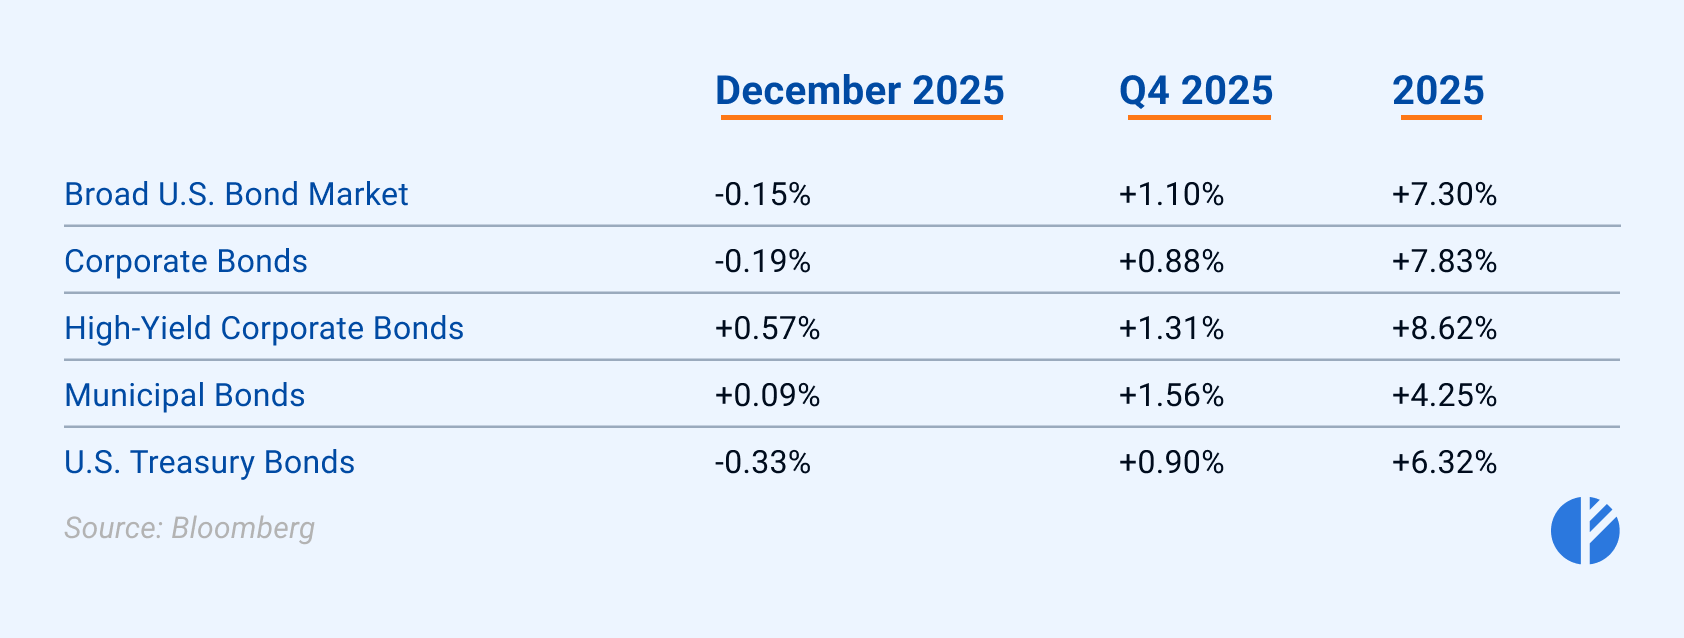
The bond market significantly benefited from the year’s yields’ decline, posting substantial returns in 2025.
The broad U.S. bond market rose 7.30%, while corporate bonds performed even better, gaining 7.83%. High-yield corporate bonds led all major categories with an 8.62% return.
U.S. Treasuries also posted solid gains, up 6.32%, and municipal bonds advanced 4.25%.
The spread between U.S. investment-grade corporate bonds and risk-free Treasury yields -
ICE BofA US Corporate Index OAS was relatively tight most part of the year16 and went beyond 1% only during the April-May tariff tensions.
Equities
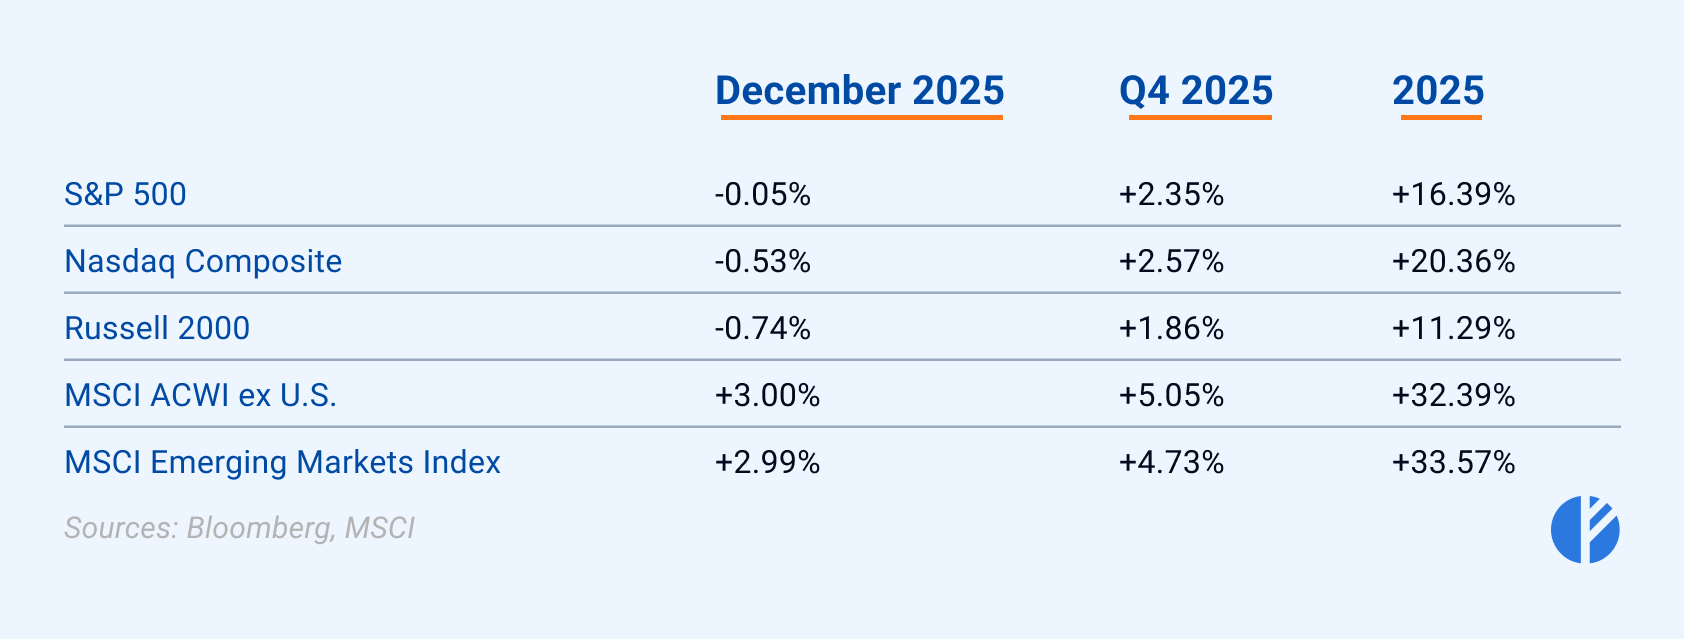
U.S. equity markets experienced significant gains in 2025,
marking the third consecutive year of double-digit gains for major indexes17.
Large-cap stocks continued to dominate, but international equities finally outperformed their U.S. counterparts.
The year opened with sharp spring declines triggered by the aggressive tariff implementations targeting dozens of countries, which pushed major indexes toward bear-market territory.
However, the market staged a swift and powerful rebound as tariff pressures moderated through partial walk-backs, a 90-day pause on steeper hikes, initial trade deals, and a temporary truce with China.
This relief sparked one of the fastest recoveries on record, with the S&P 500 surging roughly 37% from its April low to finish the year at 6,846, marking multiple all-time highs.
The rally was led by an explosive surge in AI-related stocks and reinforced by robust second- and third-quarter GDP growth, the Federal Reserve’s three rate cuts in late 2025, and the passage of the pro-business One Big Beautiful Bill Act.
Source: Morningstar
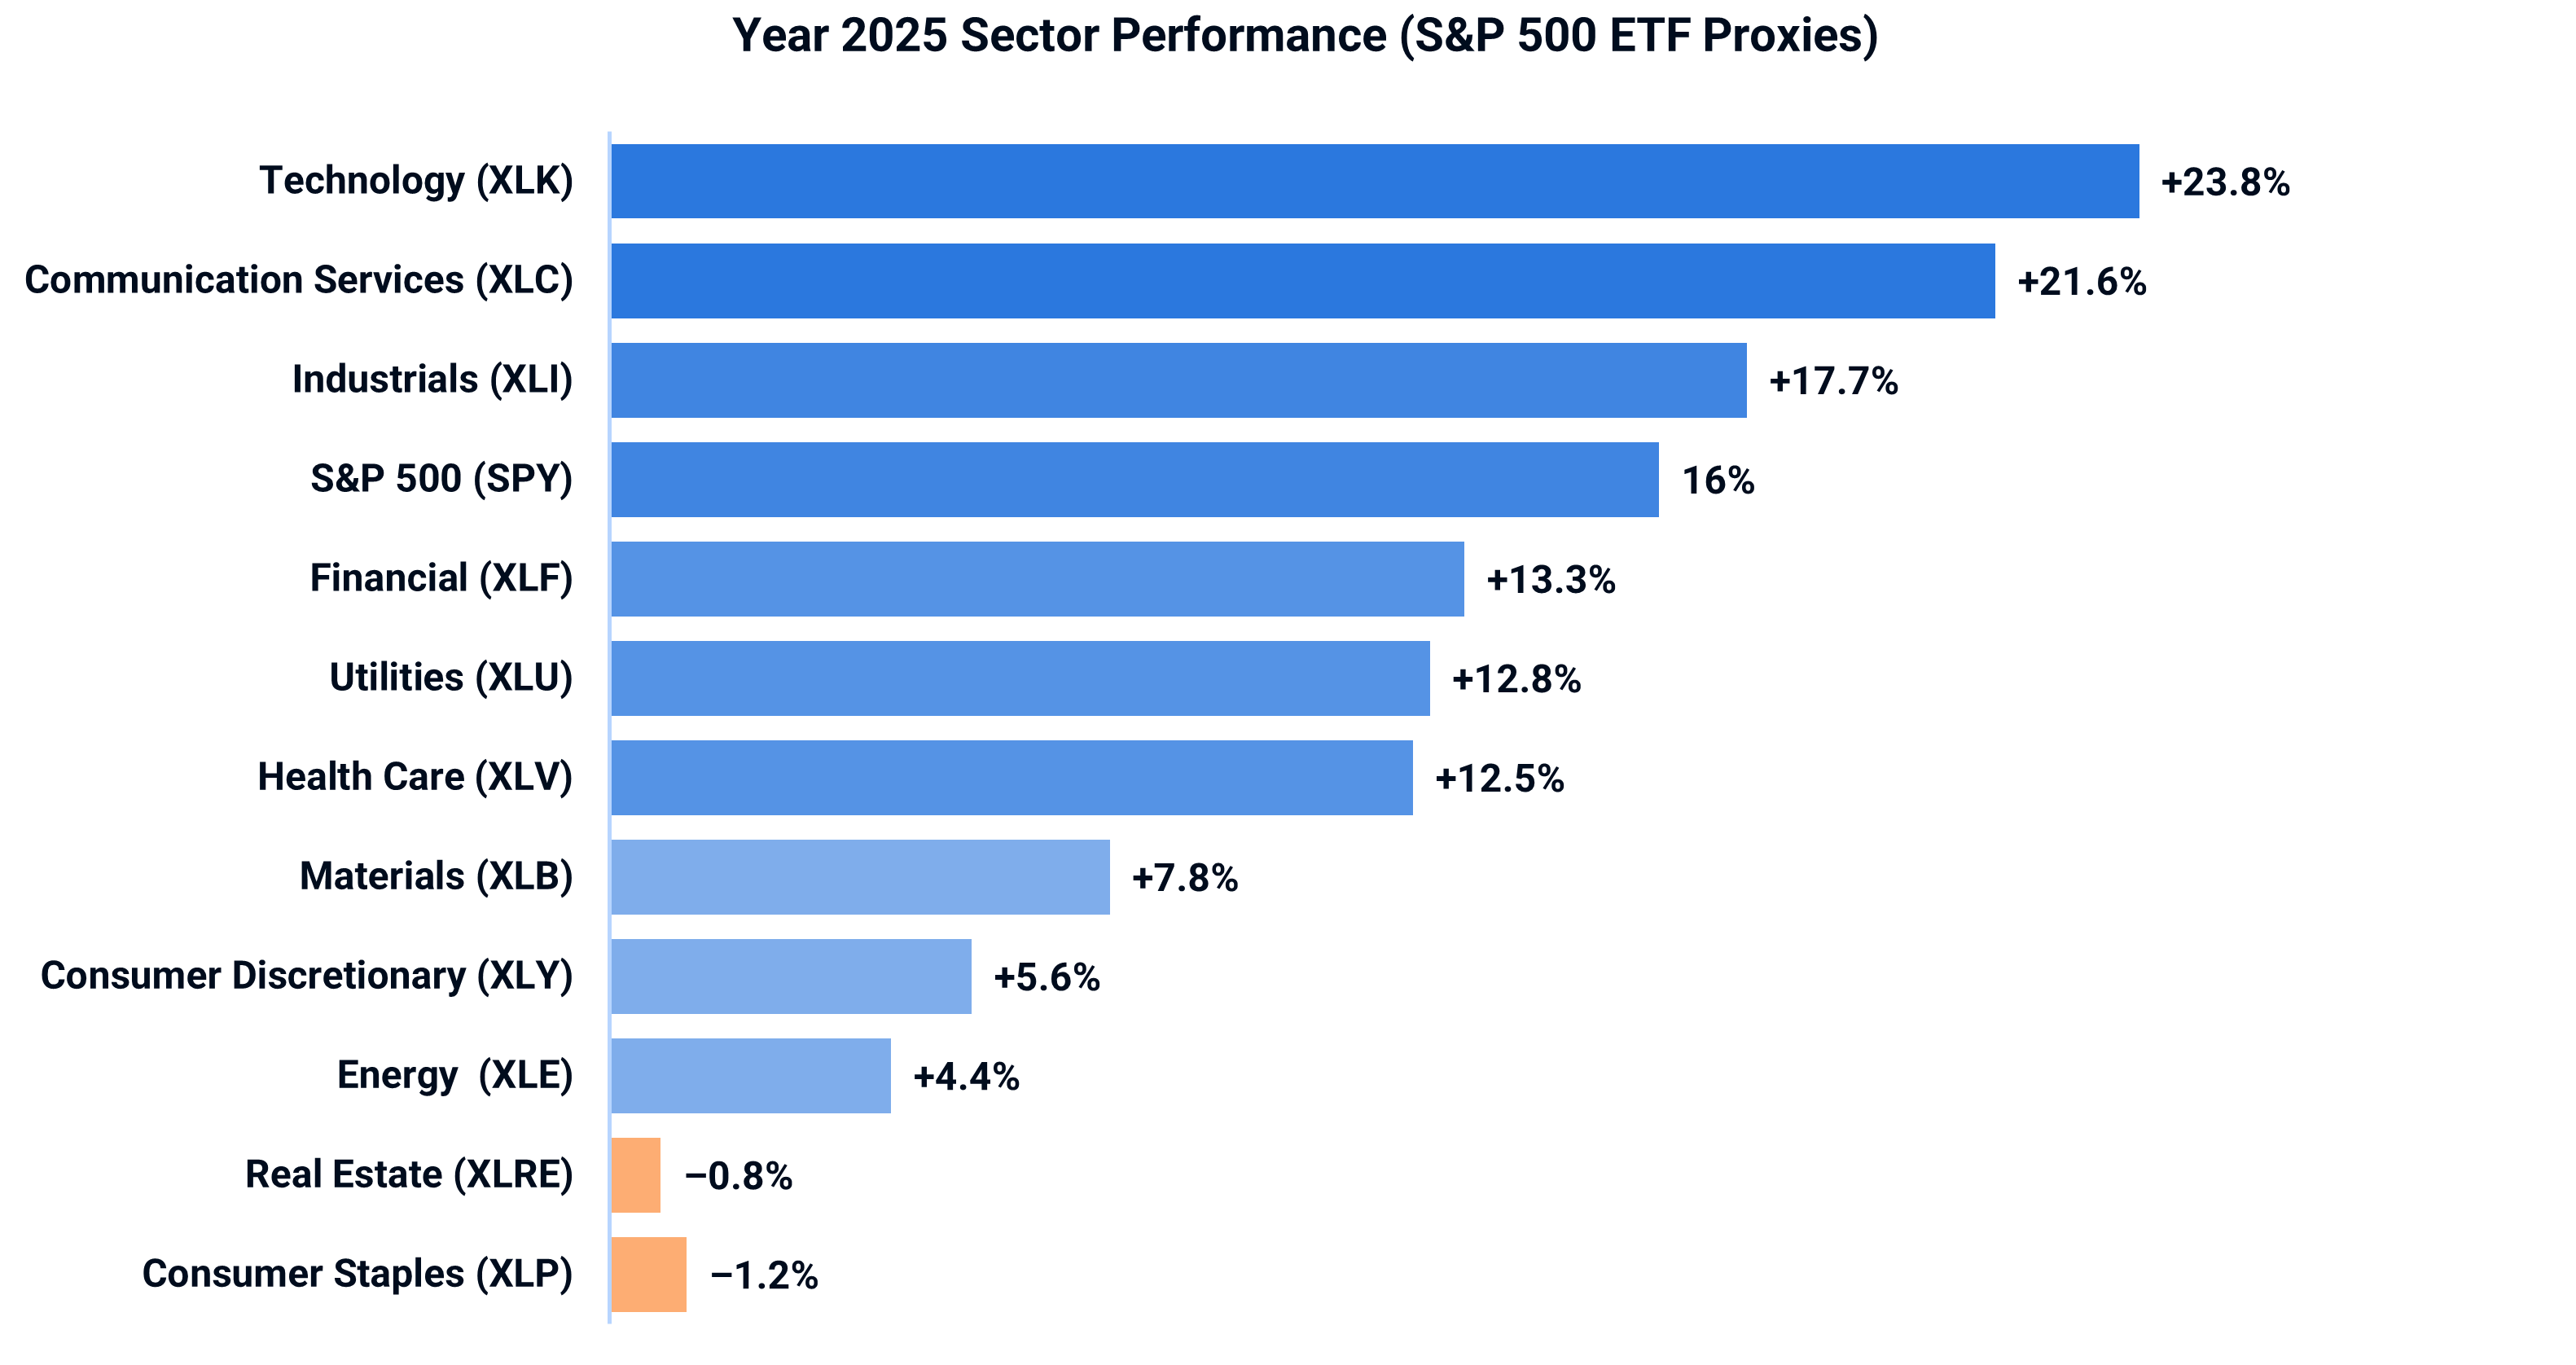
The AI rally stood as the dominant force behind the 2025 bull market, powerfully driving the Technology and Communication Services sectors to the strongest returns of the year.
Technology delivered standout gains of around 24%, while Communication Services followed closely with nearly 22%, both surpassing the S&P 500’s total return of 16%.
Industrials was the only other sector to outperform the broader index, propelled by its ties to the AI boom through surging demand for data-center construction, power generation equipment, backup systems, and supporting infrastructure needed to scale AI compute capacity.
The notable performance by AI-linked stocks rested on massive capital expenditures from the leading hyperscalers – Alphabet, Amazon, Meta, Microsoft, Oracle – as they invest heavily in the infrastructure required for next-generation AI.
Hyperscaler capex jumped dramatically from $241 billion in 2024 to an estimated $400 billion in 2025, with projections continuing to climb sharply to $533 billion in 2026 and $605 billion in 2027.
Yet, it is important to note that
analysts have consistently underestimated the scale of AI-related capital expenditures18 – and the actual spending by hyperscalers may prove to be even higher than currently projected.
A pattern observed throughout 2025 was that Wall Street consensus forecasts for AI-related capex by the major hyperscalers repeatedly fell short of the actual numbers. Starting the year with projections of around $293 billion in combined spending, estimates were revised upward multiple times as hyperscalers reported faster-than-expected buildouts.
By June, the consensus had climbed to $343 billion. By November, it had risen further to $394 billion.
Commodities
Oil
Oil prices posted their sharpest annual decline since 202019, driven by a significant global supply overwhelmed as production ramped up across both OPEC+ and non-OPEC+ regions.
Prices began 2025 on solid ground amid heightened geopolitical tensions, with WTI spot prices peaking above $80 per barrel in early January.
However, the rally faded quickly as supply dynamics took over.
WTI declined approximately 20% over the full year, closing around $57–$59 per barrel by year-end.
Brent followed a similar trajectory20, falling from an average of about $79/bbl in January to close the year around $60–$63/bbl.
Gold
Gold emerged as one of the standout performers in 2025, delivering an extraordinary surge of more than 60% over the course of the year.
Prices climbed from around $2,600 per ounce at the start of 2025 to
multiple record highs21, reaching the $4,300–$4,500 per ounce range in the second half of the year.
The rally was fueled primarily by aggressive central bank buying combined with strong safe-haven demand amid persistent geopolitical tensions, trade uncertainties, tariff threats, and broader economic and policy instability.
Silver
Much like gold, silver shattered its previous all-time high in 2025 with an even more explosive 149% surge.
What sets silver apart from gold is its dual role: while it remains a premier safe-haven asset, a significant demand comes from industrial applications, driven by its excellent electrical conductivity.
With global supply is flat and rising new demand from solar panels, EVs, 5G infrastructure, and AI-related electronics, the supply-demand imbalance is propelling silver into one of the most powerful bull runs in commodity history.
ETFs of the year
Gold
Gold's 65% surge in 2025 was fueled by its safe-haven status amid economic and geopolitical volatility, with prices hitting new all-time highs.
Physical gold ETFs tracked this closely, while mining-focused funds significantly outperformed benefiting from operational leverage.
Physical gold ETFs
Direct exposure to spot gold – up over 60%
- Goldman Sachs Physical Gold ETF (AAUU)
- SPDR Gold Shares (GLD)
- SPDR Gold MiniShares Trust (GLDM)
- iShares Gold Trust (IAU)
- iShares Gold Trust Micro (IAUM)
Gold Miners ETFs
Equity exposure with leverage to gold prices as higher gold prices flowed through to earnings – up over 150-160%
- VanEck Gold Miners ETF (GDX)
- VanEck Junior Gold Miners ETF (GDXJ)
Silver
The metal shattered its previous all-time high with an explosive 149% surge.
Physical silver ETFs
Direct exposure to spot silver – up over 145%
- iShares Silver Trust (SLV)
- abrdn Physical Silver Shares ETF (SIVR)
Silver Miners ETFs
Equity exposure with leverage – up over 160%
- Global X Silver Miners ETF (SIL)
- Global X Silver Junior Miners ETF (SILJ)
Platinum
Platinum surged an exceptional 126%, reaching all-time highs in December, amid one of the tightest supply-demand balances in the global commodities market.
This rally built on years of structural deficits22,
with the market entering its third consecutive annual shortfall in 2025, driving above-ground inventories down to approximately five months of global demand – the lowest level since 2020.
- GraniteShares Platinum Trust (PLTM) – direct physical exposure, up over 120%
Defense & Aerospace
As Defense spending is accelerating worldwide amid ongoing conflicts, with substantial increases in military budgets and strong order books,
defense and aerospace sector ETFs posted significant gains throughout the year23.
Defense & Aerospace ETFs – up over 37%
- Invesco Aerospace & Defense ETF (PPA)
- iShares MSCI Europe Aerospace & Defense ETF (EUAD)
- iShares U.S. Aerospace & Defense ETF (ITA)
- Global X Defense Tech ETF (SHLD)
Clean Energy
Amid the ongoing AI boom, a constraint of insufficient infrastructure to power rapidly expanding data-center capacity has emerged.
The rise of hyperscale data centers required to support AI workloads has led to sharp upward revisions in power-demand forecasts.
Clean-energy providers and power-equipment manufacturers have become an essential part of global digital infrastructure24.
Companies that generate electricity or supply the equipment needed for power generation and grid expansion have seen substantial share price appreciation.
- iShares Global Clean Energy ETF (ICLN) – up 44%
Semiconductors
Semiconductor stocks surged25,
propelled by robust and sustained demand for artificial intelligence, cloud computing, and next-generation data centers.
- VanEck Semiconductor ETF (SMH) – up 49%
Latin America Market
Latin American equities had an outstanding year26, and massively outperformed both the S&P 500 and MSCI Emerging Markets Index.
Among the drivers are the positive trends in commodity prices and investors recognizing attractively low valuations of the stock markets.
Broad Latin America Market ETFs
- iShares Latin America 40 ETF (ILF) – up 46%
Country-Specific Latin America Market ETFs
- iShares MSCI Mexico ETF (EWW) – up 48%
- iShares MSCI Brazil ETF (EWZ) – up 48%
- iShares MSCI Chile ETF (ECH) – up 61%
Chile particularly benefited from the copper27 rally as the country produces roughly the one-quarter of the global copper supply.
South Korea Market
- iShares MSCI South Korea ETF (EWY) – up 91%
Rare Earth Metals
Amid ongoing geopolitical tensions and supply chain security concerns, rare earths have re-emerged as crucial strategic assets.
The elements play a pivotal role in industries such as AI infrastructure, electrification, renewables, and defense29.
Their growing importance is driven by the need for advanced technologies and sustainable energy solutions, further elevating their status in the global market.
- VanEck Rare Earth and Strategic Metals ETF (REMX) – up 89%