In March 2026, the U.S. economy confronted a severe geopolitical shock.
The military campaign against Iran dominated economic and financial reality throughout the month – disrupting global energy flows,
reigniting inflation fears, and triggering a broad risk-asset selloff.
Against this backdrop, the Federal Reserve held rates steady, manufacturing continued its expansion streak, and the labor market flashed contradictory signals.
Macroeconomic Review
Inflation
The February 2026 CPI report, released on March 11, showed inflation holding steady.
Headline CPI rose 2.4% year-over-year, unchanged from January and remaining at its lowest level since May 2025.
On a monthly basis, the CPI increased 0.3%, slightly accelerating from 0.2% in January.
Core CPI, excluding food and energy, held at 2.5% year-over-year – also unchanged from January.
Monthly core CPI rose 0.2%, in line with expectations.
Critically, the February CPI report captured the last clean reading of inflation before the Iran conflict's energy shock hit the data.
The conflict began on February 28 – meaning its effects on gasoline, jet fuel, and broader transportation costs will not appear until the March CPI report, scheduled for release on April 10.
Federal Reserve Policy
The Federal Reserve held the federal funds rate unchanged at 3.50%–3.75% at its March 17–18 meeting – the second consecutive hold after three quarter-point cuts closed out 2025.
The FOMC statement was little changed from January,
with the most notable addition being an explicit acknowledgment that the implications of Middle East developments for the U.S. economy are uncertain.
The Committee reiterated that it is attentive to risks on both sides of its dual mandate.
Only Governor Stephen Miran dissented, voting in favor of an immediate quarter-point cut.
Notably, Governor Christopher Waller – who had dissented alongside Miran in January – aligned with the consensus this time,
a signal that the inflation implications of the Iran conflict weighed on even the most dovish members.
The March meeting included the quarterly Summary of Economic Projections (SEP).
The median dot plot continued to signal one rate cut in 2026 and one additional cut in 2027, unchanged from December.
However, the Committee was deeply split, seven officials expected no cuts at all in 2026, seven supported one cut, and five projected two or more cuts.
The longer-run neutral rate estimate edged up to 3.1%.
Chair Powell's press conference reinforced a "wait-and-see" posture. He emphasized that with policy currently near or slightly above neutral,
the Fed is well-positioned to observe how the energy supply shock filters through the economy before taking action.
Following the jobs report on April 3,
futures markets assigned virtually no probability to a move at the April 28–29 FOMC meeting and roughly a 77% chance the Fed would remain on hold through year-end.
Manufacturing
Manufacturing activity expanded for a third consecutive month in March,
with the ISM Manufacturing PMI rising to 52.7% – a 0.3-point increase from February and the strongest reading since August 2022.
The overall economy continued in expansion for the 17th consecutive month.
Production was the standout, with the Production Index accelerating to 55.1%, up 1.6 points from February and the fastest pace since February 2022.
New Orders remained in expansion at 53.5%, though the index moderated from February's 55.8% as demand sentiment turned more cautious –
positive-to-negative commentary shifted from a 2-to-1 ratio in February to an even split in March.
The most striking development in the March ISM Manufacturing Report was the sharp acceleration in input costs.
The Prices Index surged 7.8 points to 78.3% – its highest reading since June 2022 – following an already elevated 70.5% in February.
This represents a dramatic 19.3-point cumulative increase over just two months.
The surge was driven primarily by higher steel and aluminum costs rippling through the entire supply chain,
ongoing tariffs on imported goods, and fresh increases in petroleum-based products.
The Employment Index remained in contraction at 48.7%, essentially unchanged from February.
The index has now contracted in 30 of the last 31 months, reflecting persistent hiring reluctance amid policy and demand uncertainty.
New Export Orders slipped back into contraction at 49.9%, down 0.4 points, while Supplier Deliveries indicated continued slowing at 55.6%.
Inventories contracted further to 47.1%.
Labor Market
The March employment report, released on April 3, delivered a surprise to the upside.
Nonfarm payrolls rose by 178,000 – the strongest gain since December 2024 and roughly three times the consensus estimate of 59,000.
The unemployment rate edged down to 4.3% from 4.4%.
However, the headline number requires context.
Healthcare was responsible for 76,000 of the total gain – nearly half – driven overwhelmingly by the return of approximately 35,000
striking Kaiser Permanente physicians who had been off payrolls in February.
February's initial loss of 92,000 jobs was also revised sharply worse to a decline of 133,000, while January was revised up by 34,000 to +160,000.
Net revisions for the two prior months subtracted 7,000 jobs.
Outside healthcare, the gains were more modest but broadly distributed.
Construction added 26,000 positions, transportation and warehousing contributed 21,000, manufacturing posted a 15,000-job gain,
and social assistance continued its steady upward trend with 14,000 additions.
Federal government employment continued to decline, shedding 18,000. Financial activities lost 15,000 positions.
Taken together, the four months from December through March tell a volatile story that the headline numbers obscure.
The sequence – a loss of 17,000, a rebound to +160,000, a revised decline of 133,000, and March's gain of 178,000 – averages to just +47,000 per month.
Cross-Asset Performance Review
Equity Markets
Equity markets declined during March, with losses observed across regions, sectors, and market capitalizations.
Market participants cited geopolitical developments and rising energy prices as contributing factors to increased volatility and risk repricing.
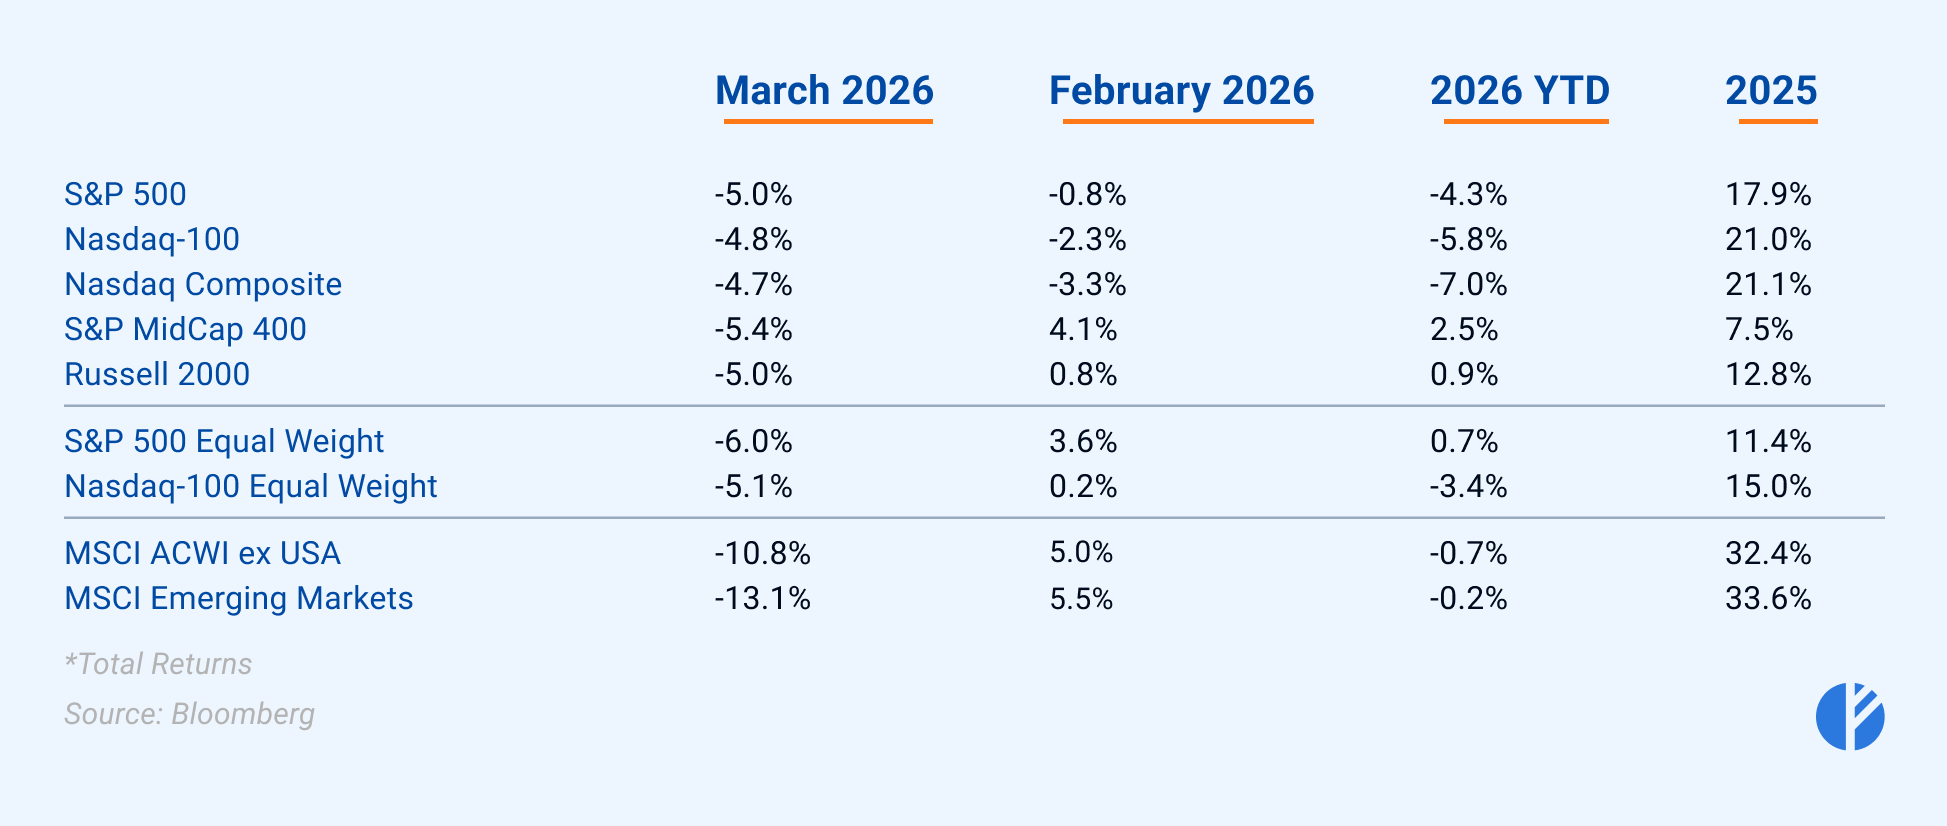
Major U.S. equity indices declined between approximately 4.5% and 6% during the month.
The S&P 500 Index decreased approximately 5%, while the Nasdaq Composite Index declined approximately 4.7%.
The S&P 500 Equal Weight Index fell approximately 6%, reflecting broad-based weakness across constituents.
International equities experienced larger declines, with developed markets outside the United States decreasing approximately 10.8% and emerging markets declining approximately 13.1%.
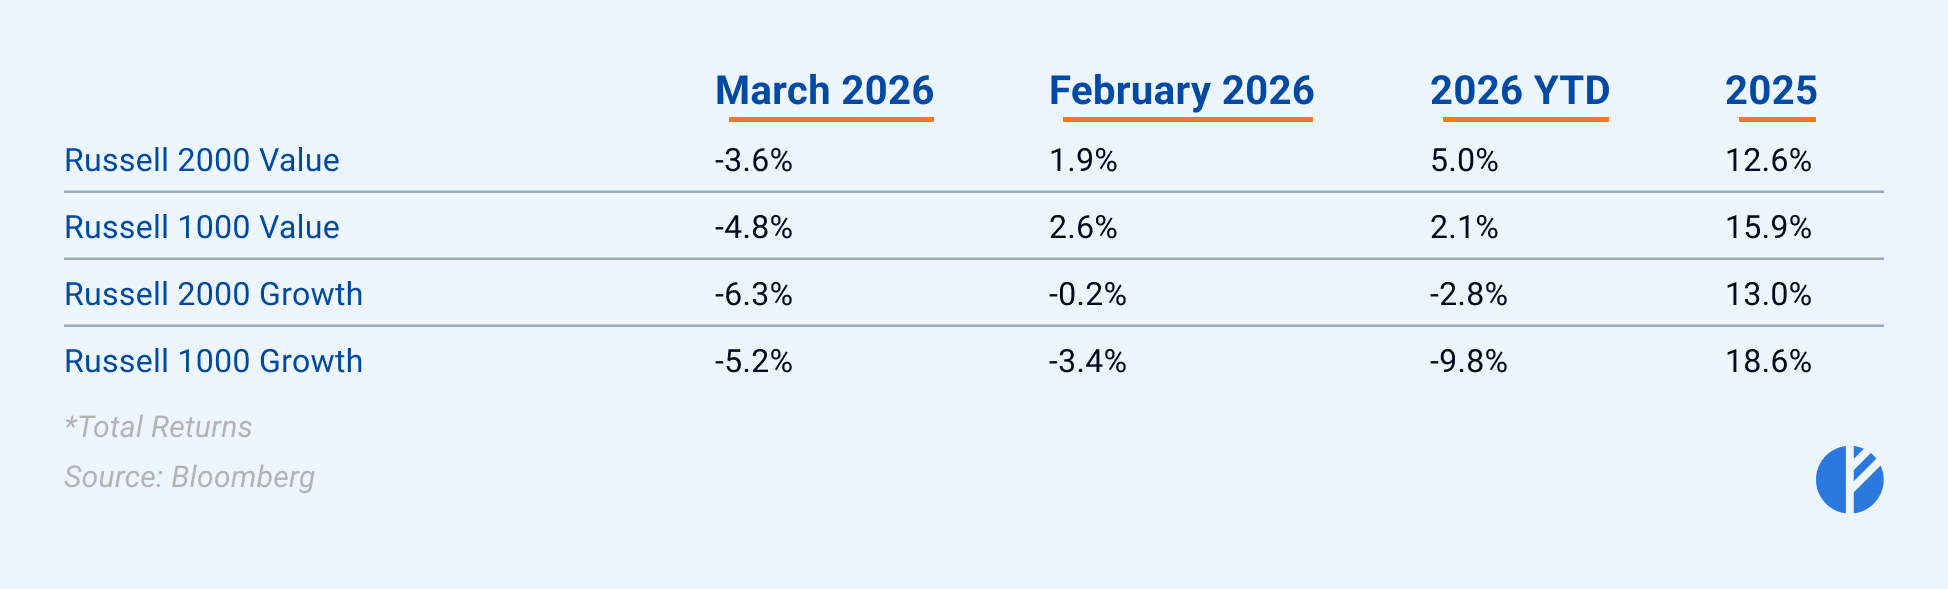
Among investment styles, small-cap growth was the hardest hit in March, with the Russell 2000 Growth Index falling 6.3%.
Small-cap value held up best, declining a comparatively modest 3.6% for the month – and remaining the top-performing domestic equity category year-to-date,
still up 5.0%.
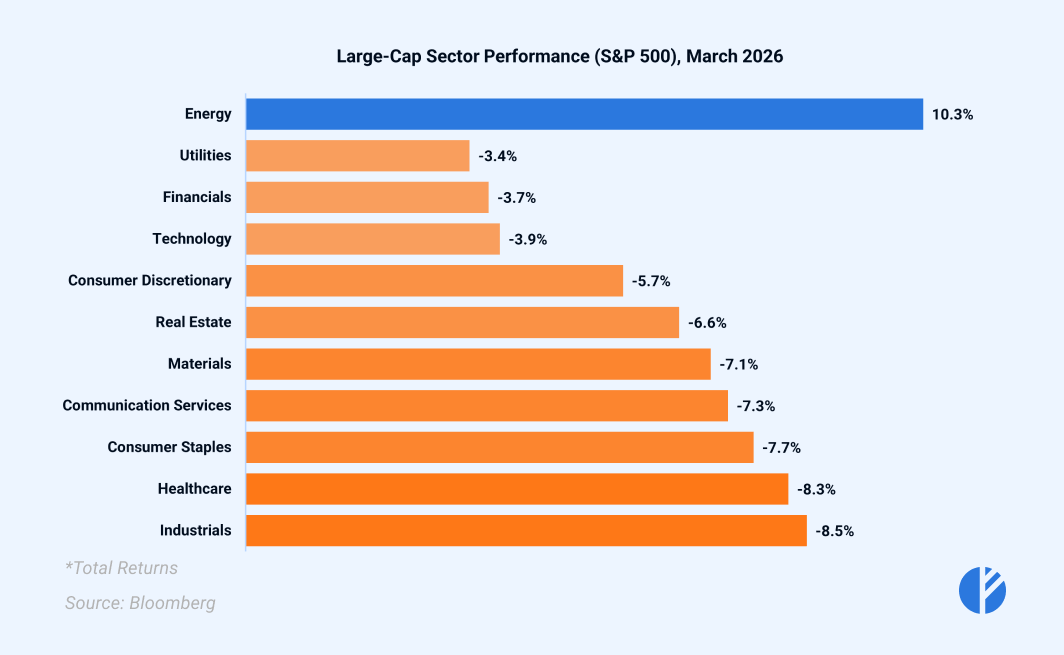
At the sector level, Energy was the sole area of strength, posting strong gains as crude prices surged.
Outside of energy, all remaining ten S&P 500 sectors finished in the red – including both cyclical groups
(Industrials, Materials, Consumer Discretionary) and defensive sectors (Utilities, Healthcare, Consumer Staples).
Fixed Income
The fixed-income landscape in March was dominated by a sharp repricing of inflation expectations,
as an energy-driven shock sent Treasury yields surging across the curve.
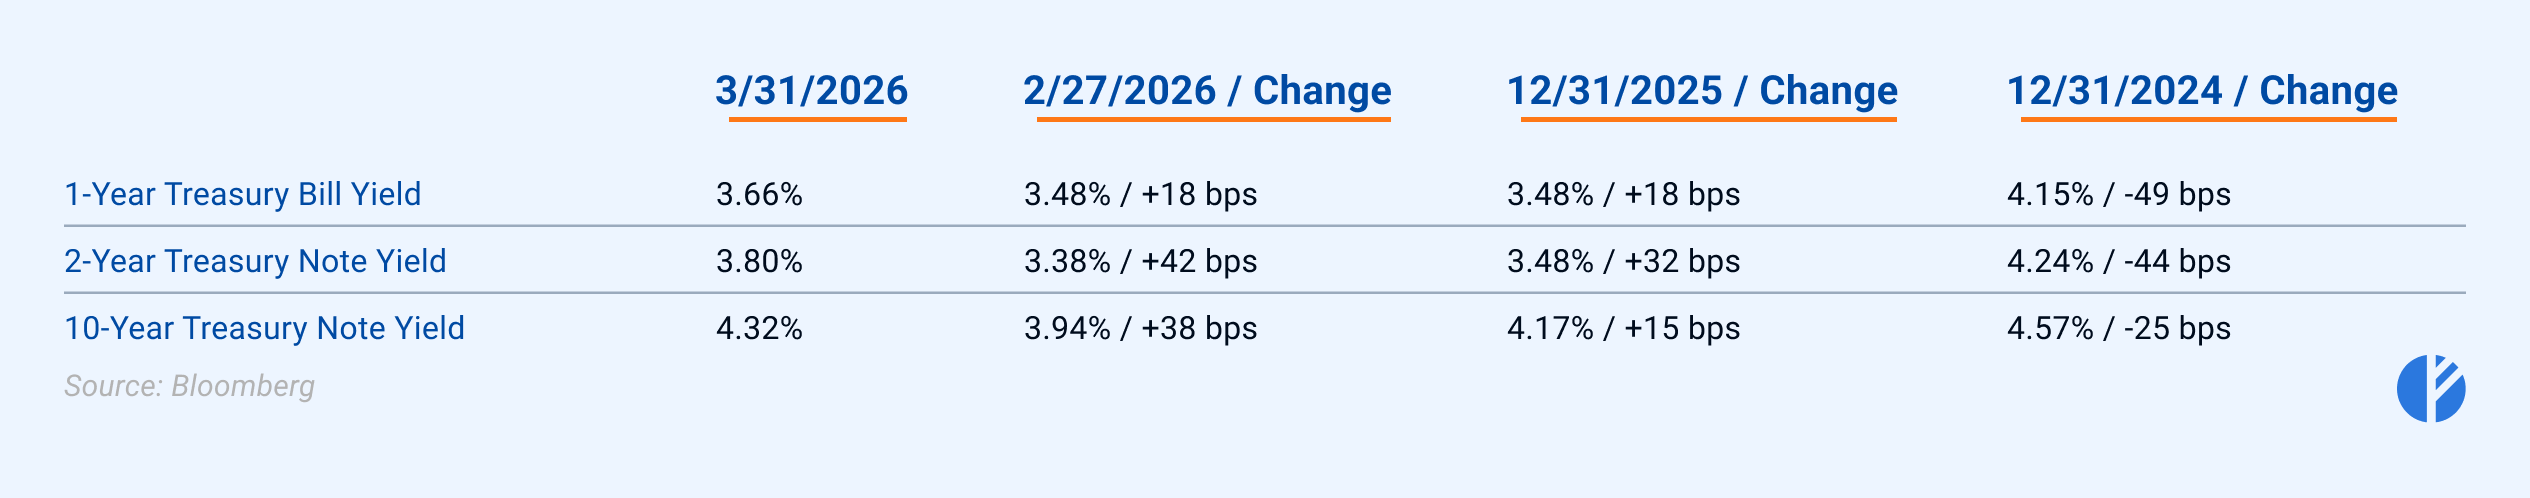
The 2-year yield jumped 42 basis points to 3.80%, erasing February's decline and signaling a significant rollback in rate-cut expectations,
while the 10-year yield climbed 38 basis points to close at 4.32%, with its weekly average of 4.38% the highest since July 2025.
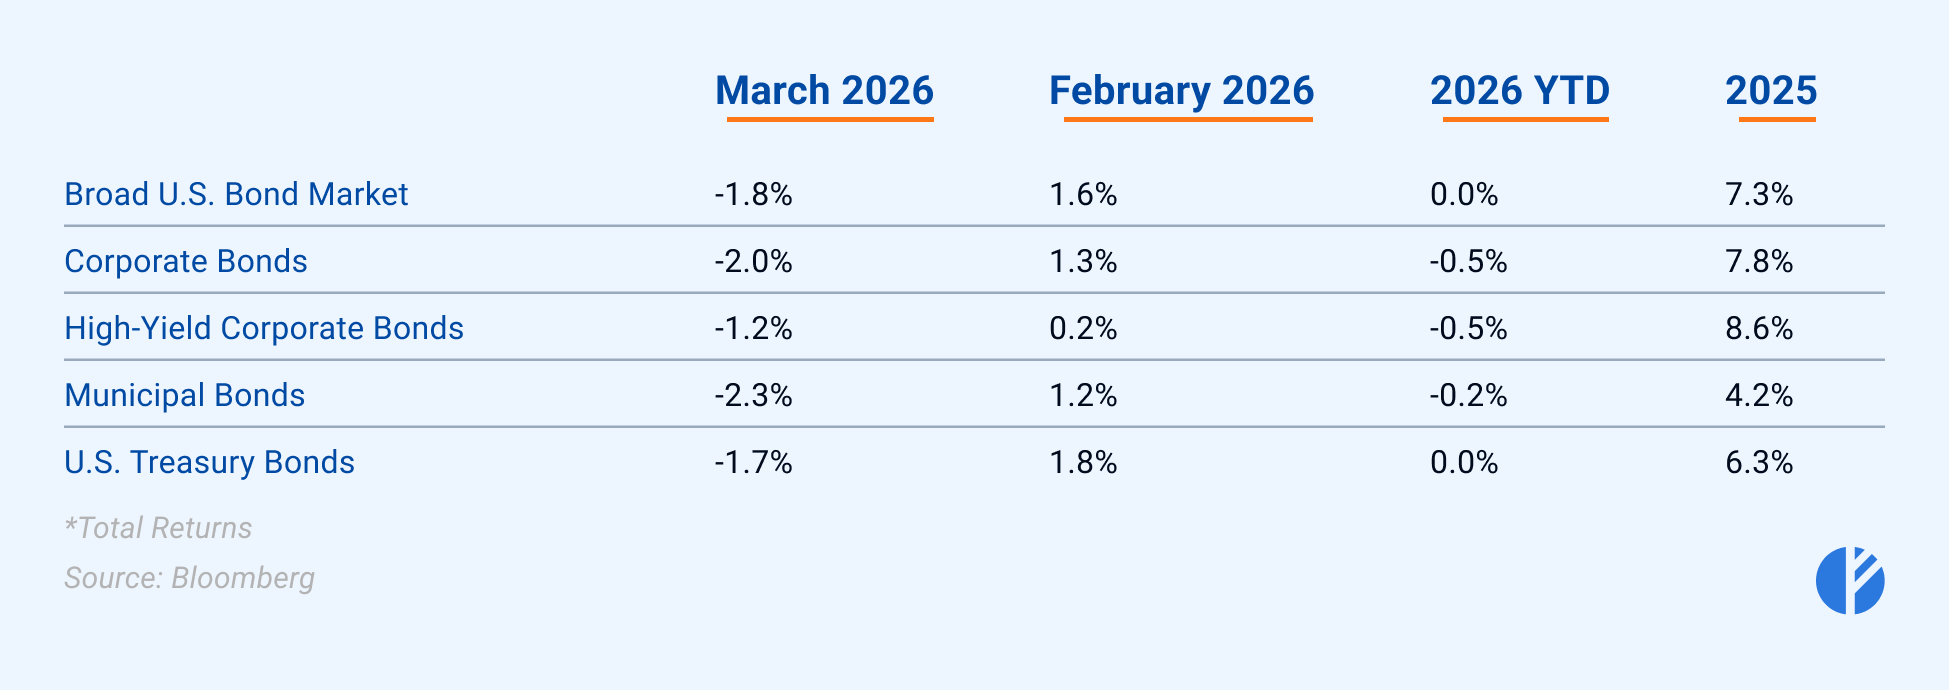
Against that backdrop, virtually every major bond category posted negative returns for the month.
Municipal bonds were the hardest hit, falling 2.3%, while high-yield corporations had a decline of just 1.2%.
Investment-grade corporates and Treasuries fell somewhere in between, leaving the broad U.S. bond market down 1.8%.
The selloff largely reflected markets pricing in the likelihood that a sustained energy shock would leave the Fed with limited room to cut rates.
Credit spreads remained relatively contained given the severity of the equity selloff.
High-yield spreads edged higher, peaking at 3.46% on March 30th, up from 3.12% at the end of February.
Investment-grade spreads widened more modestly, moving from 0.86% to 0.93% over the same period.
Commodities
Oil
Crude oil led the commodity complex in March, with one of the largest price swings seen in recent years.
Brent crude futures surged over 60% in March – a record monthly gain dating back to the contract's inception in 1988,
surpassing the previous record set during the first Gulf War in September 1990.
Brent briefly touched nearly $120 per barrel before settling around $100–$110 by month-end.
WTI crude gained over 50% for the month – its strongest monthly performance since May 2020 – and settled above $100 per barrel for the first time since July 2022.
The price rise was driven by the near-total disruption of oil flows through the Strait of Hormuz following Iran's closure of the critical waterway.
The IEA estimated that approximately 20 million barrels per day of crude and product flows were disrupted,
and Gulf producers were forced to shut in at least 10 million barrels per day of production.
Precious Metals
In a counterintuitive development, precious metals suffered their worst month in years despite an active military conflict.
Gold declined around 11-12% in March, its worst monthly performance since October 2008.
From its early-March high near $5,300, gold fell to approximately $4,600 by month-end.
The weekly rout ending March 20 was the steepest in 15 years, with gold plunging nearly 10% in a single week.
The logic was straightforward. The conflict-driven oil shock fed U.S. inflation expectations, increasing the perceived probability of Federal Reserve tightening.
Higher rates raised the opportunity cost of holding non-yielding gold, while a surging U.S. dollar made gold more expensive for non-U.S. buyers.
Silver suffered even steeper losses than gold, amplifying the precious metals selloff as its dual exposure to both financial and industrial demand left it uniquely vulnerable.
Having entered the month over $90 per ounce, silver slid steadily through the second and third weeks – falling to $80 by mid-March before briefly touching the high $60s near month-end, its lowest levels since December.
The decline reflected the same rate and dollar headwinds that weighed on gold,
compounded by growing fears that an oil-shock-driven slowdown would erode industrial consumption,
a critical component of silver demand that has no equivalent in gold.
Sources: Bloomberg, Advisor Perspectives, FedWatch, Federal Reserve Bank of St. Louis, IEA, CNBC, Federal Reserve Board, EIA