In February 2026, the U.S. economy displayed a mix of cooling inflation pressures, persistent policy caution from the Federal Reserve, and notable market rotations.
Macroeconomic Review
Inflation
The January 2026 Consumer Price Index (CPI) report showed a positive slowdown in inflation. Headline CPI rose 2.4% year-over-year, marking the lowest level since May 2025 and down from December’s 2.7%. This came in below economists' expectations of 2.5%.
Core CPI, which excludes volatile food and energy components, increased 2.5% year-over-year – the slowest pace since March 2021 – and aligned with forecasts.
In contrast, the December 2025 Personal Consumption Expenditures (PCE) Price Index – the Federal Reserve's preferred inflation gauge was released in the second half of February 2026.
Headline PCE came in at 2.9% year-over-year, up from November's 2.8% and in line with economists’ forecasts.
Core PCE accelerated to 3.0% year-over-year, up from 2.8% the prior month and matching expectations. The measures highlighted underlying pressures and explained the Fed's ongoing caution about further easing policy.
Interestingly, the typical historical pattern has CPI running lower than PCE, but recent data has reversed this dynamic. The shift largely stems from cooling housing inflation, which carries greater weight in CPI than in PCE. As shelter costs moderated notably in recent months, CPI benefited more from the slowdown.
GDP
The U.S. economy experienced a notable slowdown in the fourth quarter of 2025, with real GDP increasing at an annualized rate of 1.4%. This marked a sharp deceleration from the 4.4% recorded in the third quarter and fell well short of economists' expectations, which ranged from 2.5% to 3.0%.
The primary drag on growth stemmed from a record-long federal government shutdown, which caused federal government spending to plummet by 16.6% annualized and subtracted approximately 1.2 percentage points from headline GDP growth.
For the full calendar year 2025, real GDP expanded by 2.2%, down from 2.8% in 2024 and marking the weakest annual performance since 2022.
Federal Reserve Policy
The Federal Reserve released the minutes from its January meeting on February 18, showing a cautious stance. After three straight quarter-point rate cuts at the end of 2025, most officials showed little enthusiasm to cut rates again. They emphasized that inflation needs to show more reliable progress toward the 2% target before they would consider easing further.
In a 10-2 vote, the committee chose to keep the federal funds rate unchanged at 3.50%–3.75%, with two dissenters preferring a cut. A few participants also emphasized a more balanced language, making it clear that rate increases could be on the table if inflation stays too high for too long.
Moreover, the release of sticky December PCE data on February 20 may reinforce additional cautiousness among Fed officials.
The next FOMC meeting is set for March 17–18. As of the beginning of March, the CME FedWatch tool gives more than a 97% chance that the rates will be kept steady.
Manufacturing
Manufacturing activity continued in expansion in February, with the ISM Manufacturing PMI at 52.4% – the second month above 50% of expansion in a row and only the third one in the past 40 months. The overall economy remained in expansion for the 16th consecutive month.
All key demand indicators stayed supportive, though with some moderation from January's sharp rebound. The New Orders Index remained solidly in expansion at 55.8. The Backlog of Orders Index strengthened notably to 56.6%, up 5 percentage points and reaching its highest reading since May 2022. Customers’ Inventories Index dipped further into the “too low” territory at around 38.8%.
On the output side, the Production Index stayed in expansion for the fourth consecutive month at 53.5%, though it cooled by 2.4 points from January's 55.9%. The Employment Index improved marginally to 48.8%, up 0.7 points, but remained in contraction for the 13th straight month.
Inputs showed a mixed picture with notable intensification on the cost front. The Supplier Deliveries Index rose to 55.1%, signaling further slowing in delivery times. The Inventories Index edged up but stayed in contraction at 48.8%. Most strikingly, the Prices Index surged to 70.5%, an 11.5-point jump from January's 59% and its highest level since June 2022.
Labor Market
The labor market showed unexpected strength in January, with nonfarm payroll employment rising by 130,000 jobs – significantly exceeding economists' forecasts and marking the strongest monthly gain in over a year. The unemployment rate edged lower to 4.3% from 4.4% in December.
Healthcare added approximately 82,000 jobs, while social assistance contributed another 42,000, continuing their role as the primary drivers of employment growth. Construction saw a solid increase of around 33,000 jobs, boosted by demand for data centers and related infrastructure. Manufacturing posted a modest gain of 5,000 jobs – the first monthly increase in the sector in more than a year.
On the other hand, federal government employment declined by 34,000, while financial activities and information sectors together shed about 34,000 jobs.
The December 2025 jobs figure was revised downward, from an initial gain of 50,000 to 48,000.
The annual data revisions resulted in a much weaker picture of the 2025 labor market. Total nonfarm payroll growth for the full year was revised sharply downward to just 181,000 jobs added, compared to the earlier estimate of 584,000.
Cross-Asset Performance Review
Equity
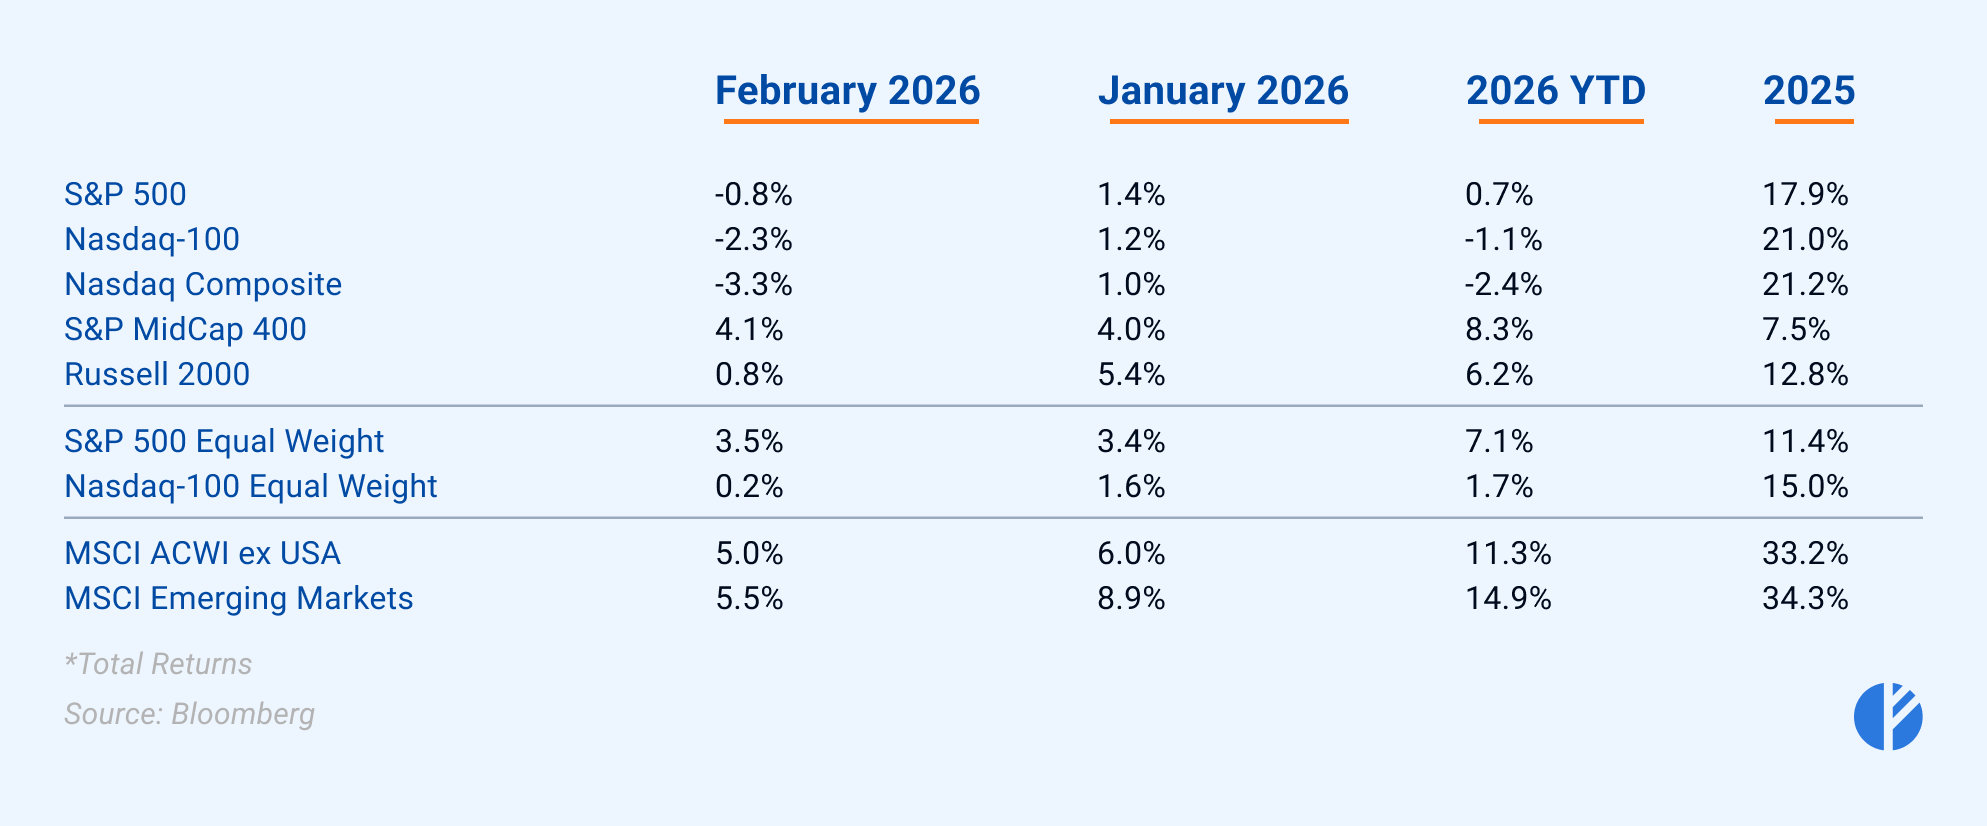
U.S. equity markets delivered a mixed performance, marked by significant sector and style rotation beneath the surface of the major indices.
The S&P 500 declined 0.8%, recording its second monthly drop in the past three months. The Nasdaq Composite shed 3.3%, while the Nasdaq 100 fell 2.3% – marking the worst monthly declines for both indexes since March 2025.
In contrast, U.S. small- and mid-cap segments showed relative strength. The Russell 2000 posted a modest gain of 0.8%, while the S&P MidCap 400 surged 4.1%, delivering its strongest monthly performance since May 2025.
International equities outperformed notably. The MSCI ACWI ex USA advanced approximately 5.0%, and the MSCI Emerging Markets index rose 5.5%.
The divergence highlighted a continued rotation away from the US mega-cap concentration. The Magnificent 7 suffered their worst month since March 2025, plunging more than 7% amid intensifying investor concerns over potential AI disruption, high capital expenditures, and stretched valuations – particularly pressuring software and technology companies.
The S&P 500 Equal Weight Index rallied 3.5%, posting its strongest monthly gain since May 2025 and outperforming the cap-weighted S&P 500 for the fourth consecutive month. Even the Nasdaq 100 Equal Weight Index managed a modest 0.2% advance, despite the heavy drag from its largest constituents.
These dynamics reveal an ongoing rotation away from concentration in a handful of mega-cap companies toward a more diversified and balanced opportunity set that spans sectors, company sizes, and geographies. Investors are reallocating capital into U.S. mid- and small-cap stocks, non-tech cyclical and defensive sectors, and international markets.
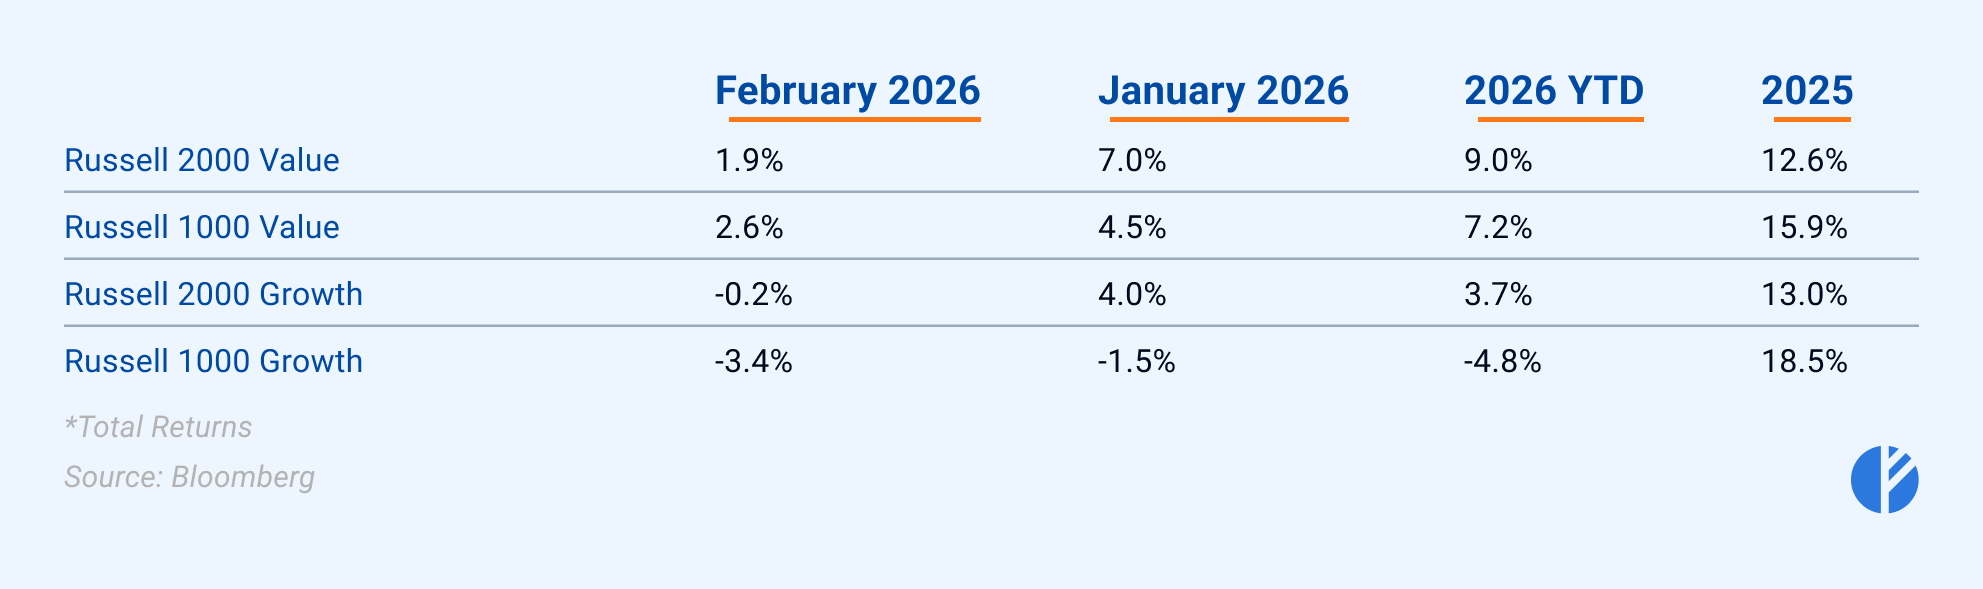
The growth-value division remained notable, as investors continued to pivot away from speculative momentum and high-valuation stocks toward more fundamentally grounded, value-oriented companies.
The rotation was evident across market caps, Small-cap Russell 2000 Value advanced 1.9%, outperforming Russell 2000 Growth, which slipped 0.2%. Large-cap value showed even greater strength, with Russell 1000 Value gaining 2.6% – outpacing small-cap value – while Russell 1000 Growth posted the weakest performance of the group, declining 3.4%. This further reinforces the broader market narrative, a shift in leadership from large-cap growth stocks, significantly dominated by mega-cap tech and momentum-driven names toward value stocks across caps.
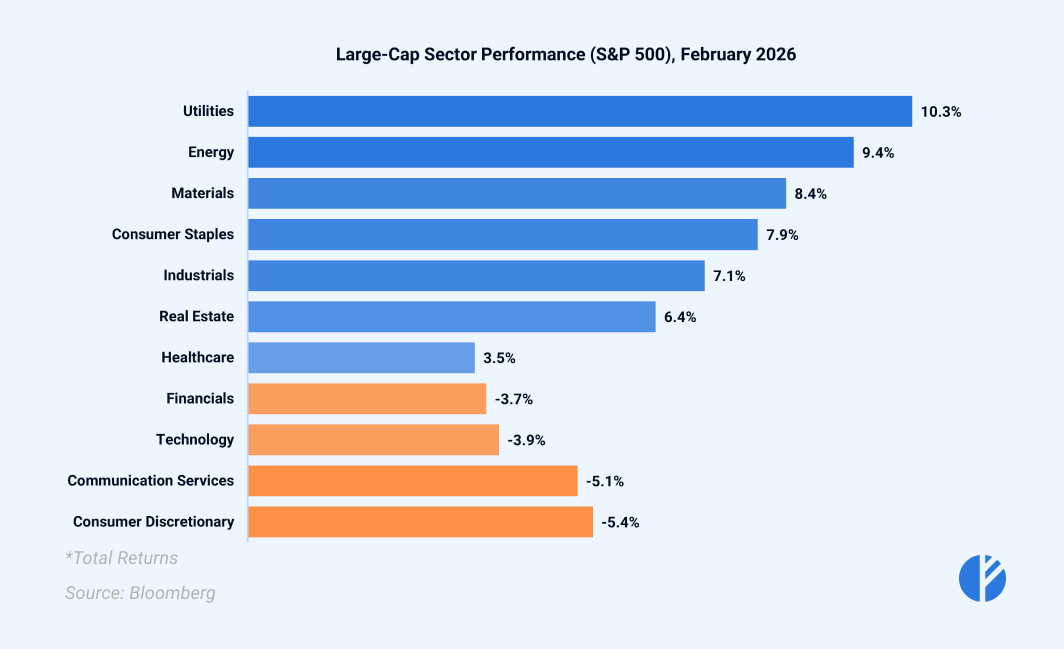
Among large-cap sectors, improved market breadth and rotational dynamics were pronounced as well. Primarily, defensive and commodity-related sectors led the advance, with Utilities, Energy, Materials, Staples, Industrials, Real Estate, and Healthcare rising 3% to 10%, and reflecting the shift in investor preferences amid resilient consumer spending, heightened geopolitical tensions, and decreasing interest rates.
In contrast, the laggards were Financials, Technology, Communication Services, and Consumer Discretionary, with the former three particularly suffering from the shift away from growth names.
Fixed Income
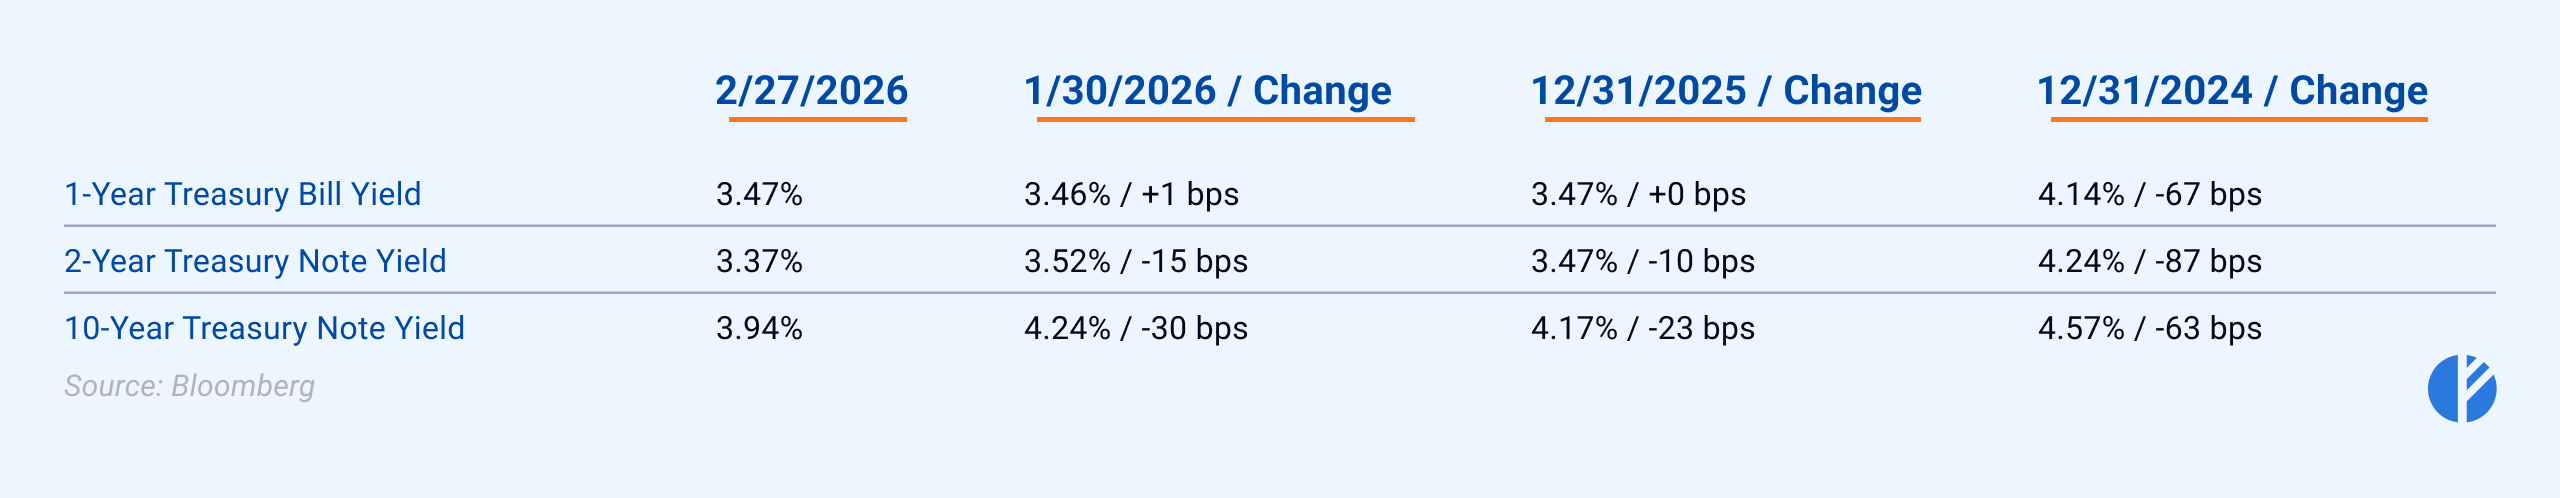
U.S. Treasury yields saw notable changes, the 10-year Treasury yield fell 30 basis points to end the month at 3.94% – its largest monthly drop since February 2025 – driven primarily by cooling inflation data and a flight to safety amid geopolitical tensions. The 2-year Treasury yield declined 15 basis points to 3.37%, reaching its lowest level since August 2022, reflecting rising market conviction that the Federal Reserve will resume rate cuts later in the second half of 2026, even as near-term policy remains on hold. The 1-year Treasury yield stayed stable, underscoring the Fed's current pause on cuts.
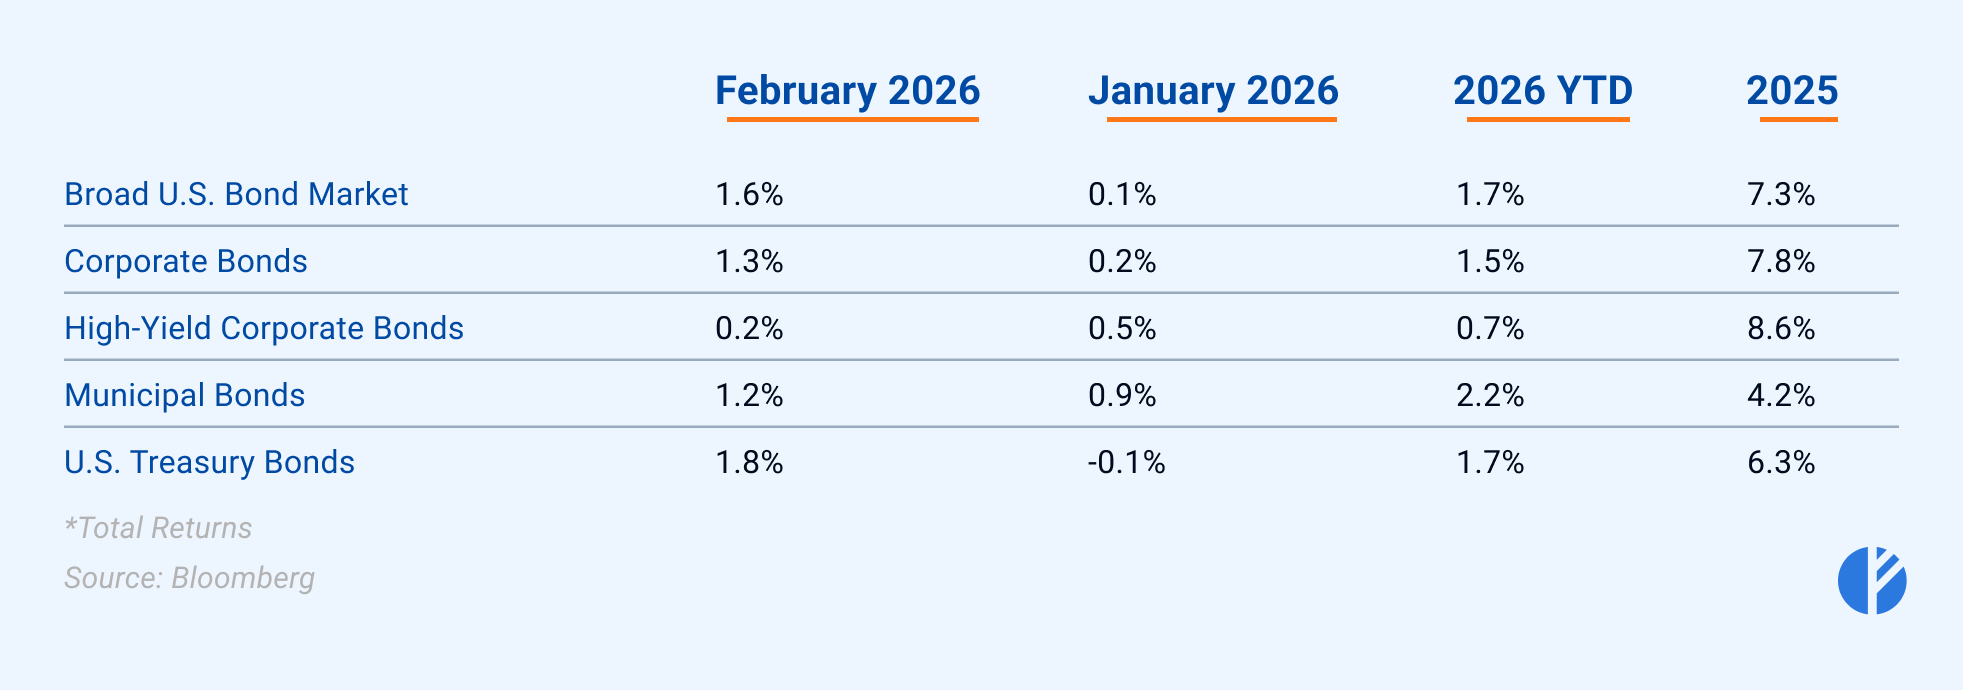
The fixed-income market rallied strongly, fueled by declining Treasury yields and flight to safety amid escalating geopolitical tensions. The broad U.S. bond market gained 1.6%, with U.S. Treasuries leading the way at 1.8% as the primary beneficiary of duration exposure and safe-haven demand. Investment-grade corporate bonds added 1.3%, while municipal bonds rose 1.2%, both capturing solid gains from the rate decline and supportive technicals.
High-yield corporate bonds were the only laggard, gaining just 0.2%. The underperformance stemmed largely from credit spread widening relative to Treasuries, offsetting much of the positive carry and price lift from falling rates. U.S. high-yield option-adjusted spreads (OAS) widened by 24 bps throughout the month, moving from 2.88% at end-January to a peak near 3.12% by late February. Investment-grade corporate spreads also widened, from 0.75% to 0.85% throughout the month.
A significant contributor to the widening was idiosyncratic credit stress, mostly stemming from the concerns from the private credit sector.
Commodities
Oil
Crude oil prices exhibited notable volatility, reflecting oversupply concerns early in the month and escalating geopolitical risks later on. WTI crude futures opened the month softer, dipping from late-January levels around $65/bbl. to a range of $61–$63/bbl through most of the first half of February. However, sentiment shifted sharply in the second half as geopolitical tensions intensified, injecting a significant risk premium into the market. WTI futures rallied toward month-end, closing February around $67/bbl.
Precious metals
Precious metals staged a strong recovery in February following sharp volatility at the end of January and into early February. Gold gained approximately 7-8% over the month. By late February, spot gold climbed back toward $5,200–$5,300 per ounce, recovering much of the territory near January's all-time highs. This marked its 13th monthly gain in the past 14 months.
Silver was even more bullish, outperforming gold with a rise of around 10%, pushing prices toward $93 per ounce by month-end. The metal has advanced for ten consecutive months.
Sources: Nasdaq, The Wall Street Journal, Market Watch, FRED, ISM, Reuters, CNBC