In January the U.S. economy showed signs of steady momentum amid evolving political and geopolitical developments. Equities maintained positive traction with broadening participation, manufacturing re-entered expansion territory, and commodities delivered dramatic swings.
Major Headlines
$200 Billion Fannie/Freddie MBS Buy
On January 8,
President Donald Trump announced that he was directing Fannie Mae and Freddie Mac to purchase $200 billion in mortgage-backed securities (MBS)1 from the public market. The directive is designed to inject substantial buying pressure into the secondary mortgage market, driving down yields on agency MBS and, in turn, lowering borrowing costs for homebuyers – helping to make mortgages more affordable.
Next Fed Chair
On January 30, President Donald Trump nominated Kevin Warsh to serve as the next Chair of the Federal Reserve, positioning him to succeed current Chair Jerome Powell when Powell's term concludes in May.
Warsh, who
built his early career in mergers and acquisitions at Morgan Stanley2 and serving as a special assistant for economic policy in President George W. Bush's administration, became the youngest-ever Federal Reserve Governor at age 35 when appointed in 2006, serving until 2011.
During his tenure, he
earned a reputation as an interest-rate hawk3, favoring higher rates to anchor inflation expectations. In recent years, however, Warsh has advocated for lower interest rates, criticizing the Fed's caution over inflation risks from last year's tariffs – while still expressing limits on aggressive easing.
His nomination arrives at a sensitive moment for the Fed, as it navigates still somewhat elevated inflation alongside softening labor-market momentum, with Warsh's approach expected to draw significant attention from markets and policymakers.
Macroeconomic Review
Inflation
January’s CPI and PCE reports are scheduled for release in mid‑February.
As a result, the latest available inflation data remains the December CPI report, published in the first half of January,
which showed headline inflation at 2.7% year‑over‑year and core inflation at 2.6%4. This effectively marks 2025 as a year in which inflation held at or below 3%, reflecting a notable cooling compared with the post‑pandemic period.
GDP
The advance estimate for fourth quarter of 2025 GDP is set to be released on February 20, 2026.
The updated third quarter estimate, published in mid January, remains the most recent figure and
shows strong growth of 4.4%5.
Federal Reserve Policy
The Federal Reserve kept its benchmark rate unchanged at 3.50%–3.75% during its January meeting.
Policymakers expressed a more optimistic view of the economic outlook compared with late 20257. Chair Jerome Powell noted that the Fed’s dual mandate is becoming more balanced, pointing out that while hiring and labor demand have leveled off, the unemployment rate remains relatively low.
As in prior meetings, opinions among members were divided. This time, Governors Stephen Miran and Christopher Waller dissented, voting in favor of a quarterpoint rate cut.
Manufacturing
Manufacturing activity returned to expansion in January8, with the ISM Manufacturing PMI rising to 52.6% – the first expansion in 12 months and a 4.7 points increase from December’s seasonally adjusted 47.9%.
All three major demand indicators moved into expansion. New orders rose sharply to 57.1%, up 9.7 points from December and the highest level since February 2022. The Backlog of Orders Index increased to 51.6%, a 5.8-point gain and the strongest reading since August 2022. Meanwhile, the Customers’ Inventories Index fell 4.6 points to 38.7%, placing it firmly in the “too low” range – often a positive signal for future production.
While these trends point to a constructive start to the year, industry commentary suggests that January often reflects postholiday restocking, and some firms appear to be advancing purchases in anticipation of price increases tied to ongoing tariff concerns.
As for the output, The Production Index remained in expansion for the third consecutive month. January’s reading of 55.9% was 5.2 points higher than December’s seasonally adjusted 50.7% and marked the strongest level since February 2022. The Employment Index, while still in contraction territory, improved by more than 3 points to 48.1%.
Inputs remained mixed, the Supplier Deliveries Index pointed to slower delivery times, the Inventories Index remained in contraction, and the Prices Index continued to rise.
Labor Market
The January employment report from the Bureau of Labor Statistics is scheduled for release on February 11.
Until then, the December 2025 report published in early January remains the most recent official data.
The report revealed nonfarm payrolls rose by only 50,000 jobs9, missing economists’ median forecast of 70,000, while downward revisions to prior months erased a combined 76,000 positions from earlier estimates.
For the full year 2025, nonfarm payroll growth totaled just 584,000 jobs – less than one-third of the roughly 2 million added in 2024 – highlighting a marked slowdown in hiring momentum.
The unemployment rate edged down slightly to 4.4% in December from 4.5% in November, though it remained above the 4.0%–4.3% range seen earlier in 2025. Bloomberg’s economist survey currently projects the January unemployment rate to hold steady at 4.4%, signaling expectations of continued labor-market stability rather than a significant further softening as the new year begins.
Cross-Asset Performance Review
Equity
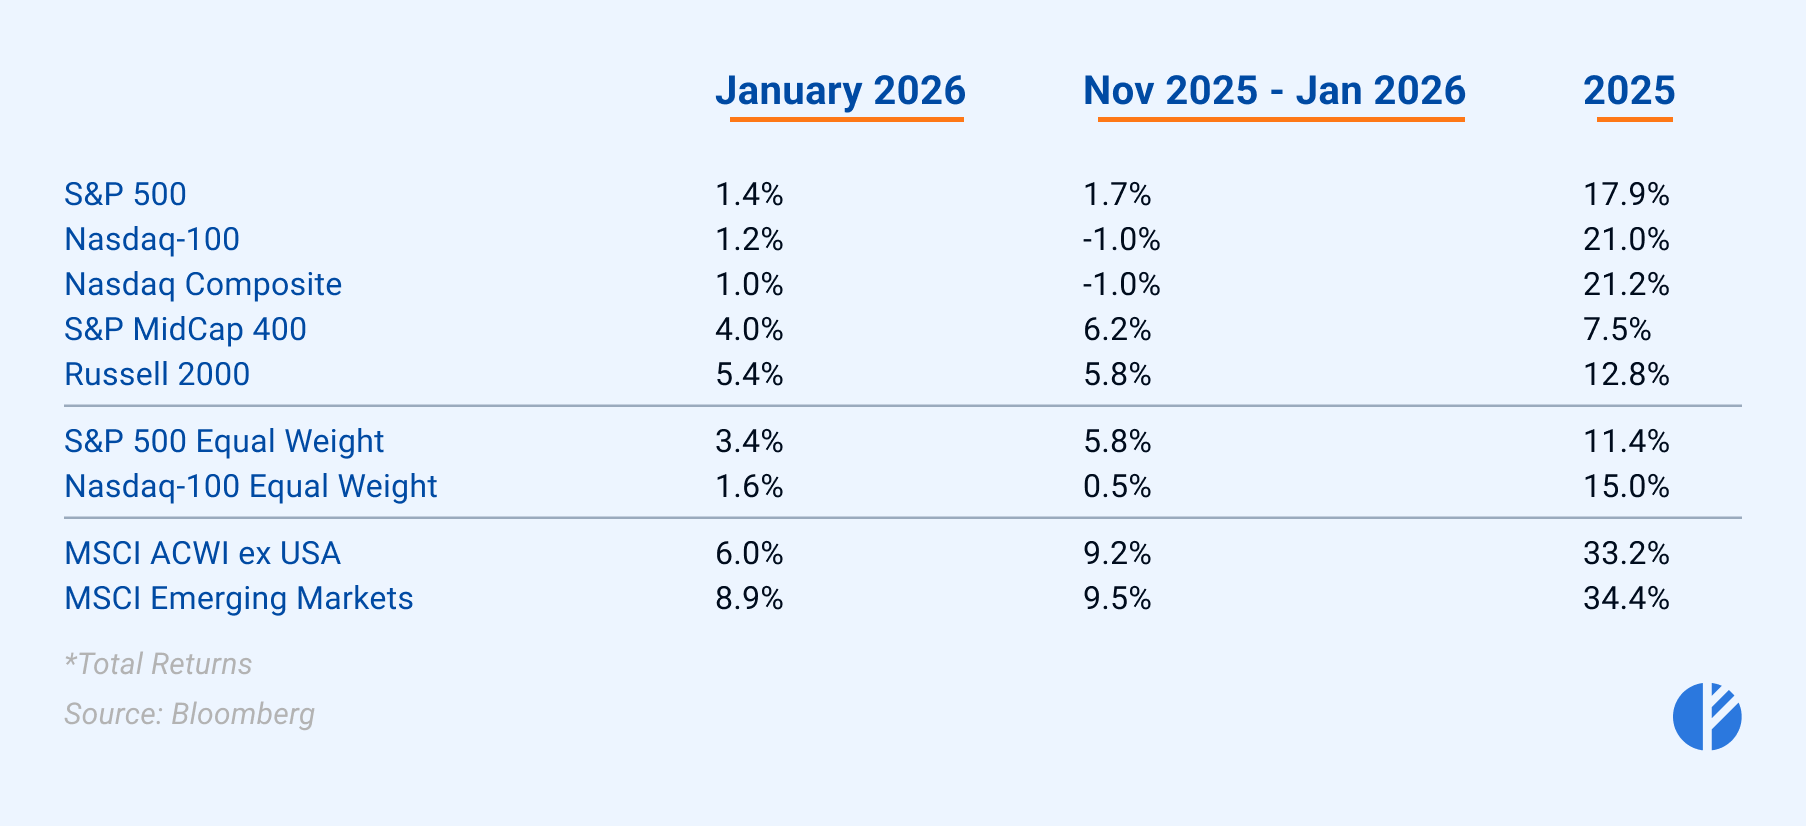
Equities carried forward their positive momentum from late 2025 into January 2026, with notable broadening in market participation. In the U.S., small- and mid-cap stocks led the way, with the Russell 2000 and S&P MidCap 400 posting strong gains of around 4%–5%. International equities showed even stronger performance with developed markets rising by approximately 6%, while emerging markets surging nearly 9%. In contrast, U.S. large-cap benchmarks lagged, with the S&P 500 and Nasdaq Composite posting more modest increases of roughly 1%–1.4%.
Equal-weight versions of the S&P 500 and Nasdaq 100 outperformed their cap-weighted counterparts –
highlighting improved breadth10 and a shift away from narrow mega-cap leadership.
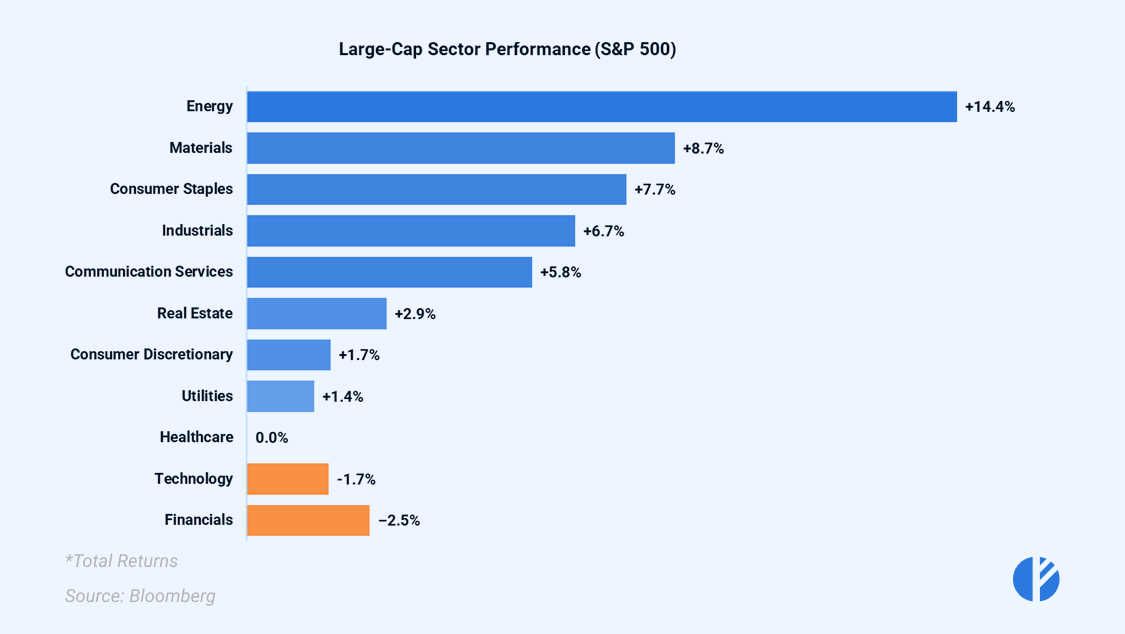
The sector level performance was primarily led by the risk-supportive environment with rotation toward cyclical sectors – Energy, Materials, Industrials.
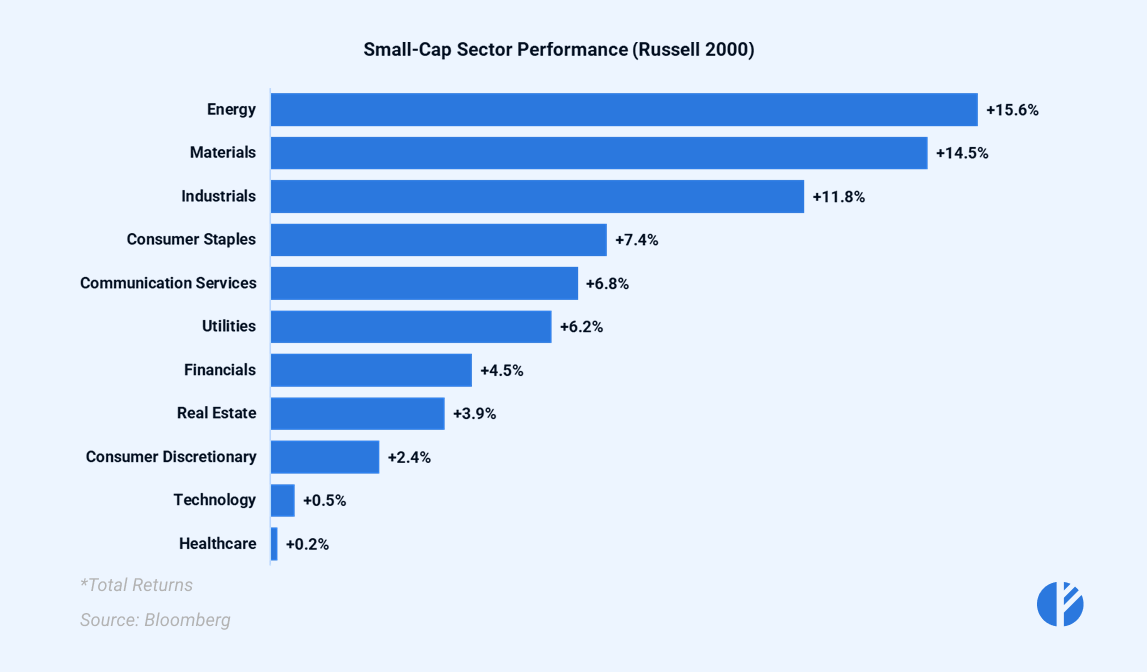
The small-cap stocks further underscored January 2026’s pro-risk, pro-cyclical dynamics, as investors displayed increasing appetite for these higher-risk assets. Just like in large caps, cyclical sectors led the advance with Energy, Materials, and Industrials each posting gains of more than 10% for the month.
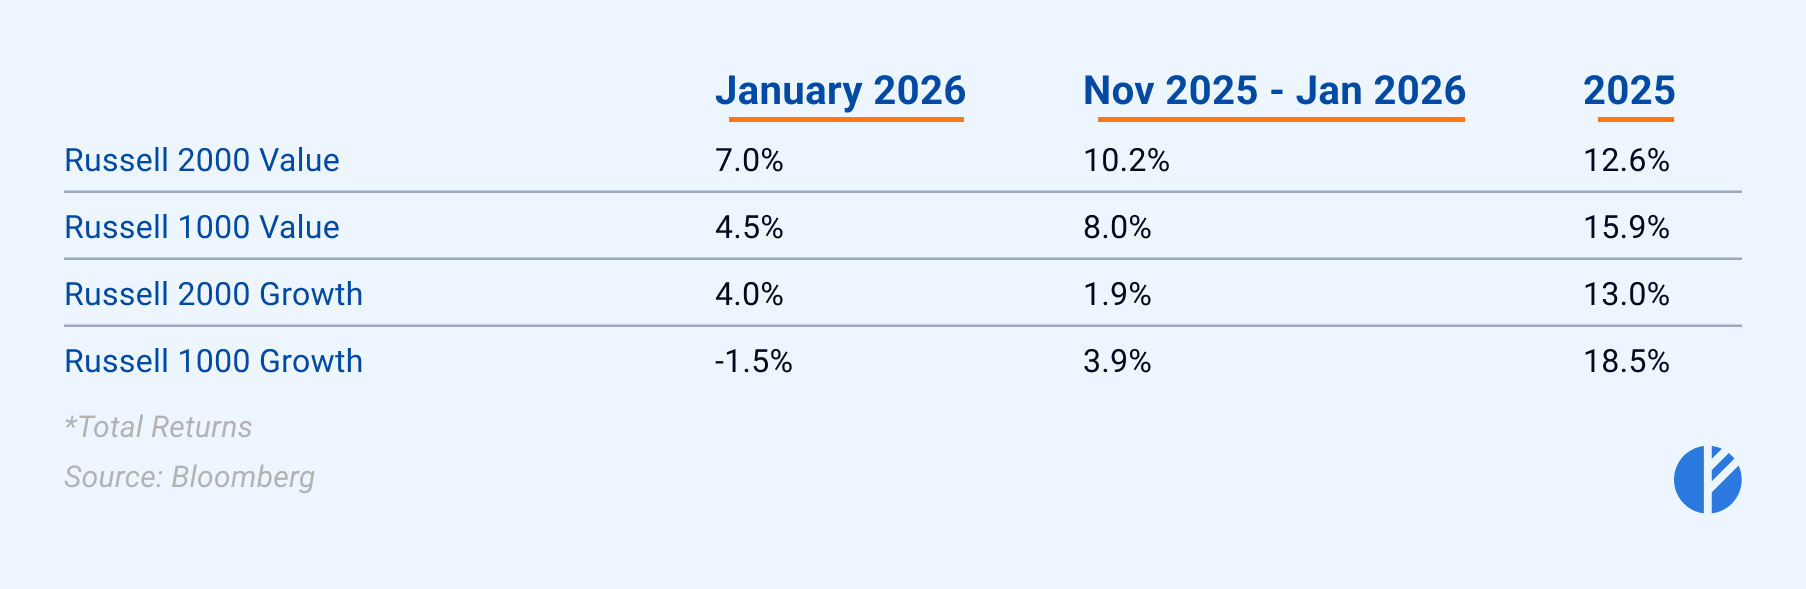
Another recent trend that carried into January 2026 was the continued rotation toward value stocks, which outperformed growth across both large- and small-cap segments, with the relative strength especially pronounced in small caps.
Analysts emphasize that this shift is not a rejection of growth stocks, but is a healthy broadening of market participation, with investors rebalancing toward a more diversified and balanced portfolio.
Fixed Income
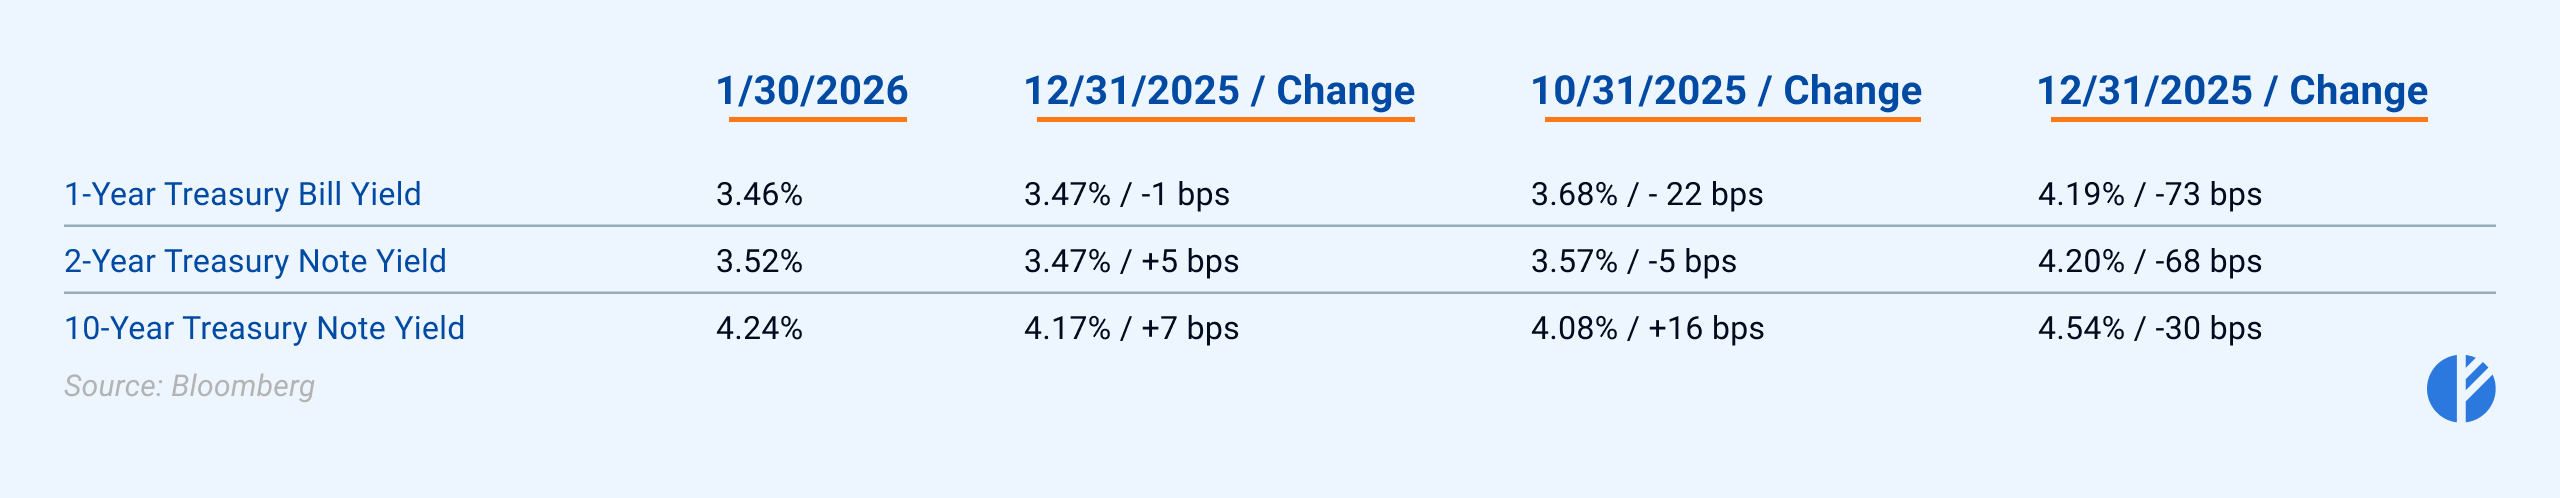
In January, U.S. Treasury yields exhibited only modest changes across the curve, reflecting cautious Fed policy expectations and lingering inflation concerns amid geopolitical and fiscal uncertainties. The 1-year T-bill yield stood at 3.46%, the 2-year note yield rose to 3.52%, and the 10-year note yield climbed to 4.24%. Short-end yields remained anchored near the Fed’s 3.50%–3.75% target range, while longer maturities drifted higher due to sticky inflation and
fiscal concerns11.
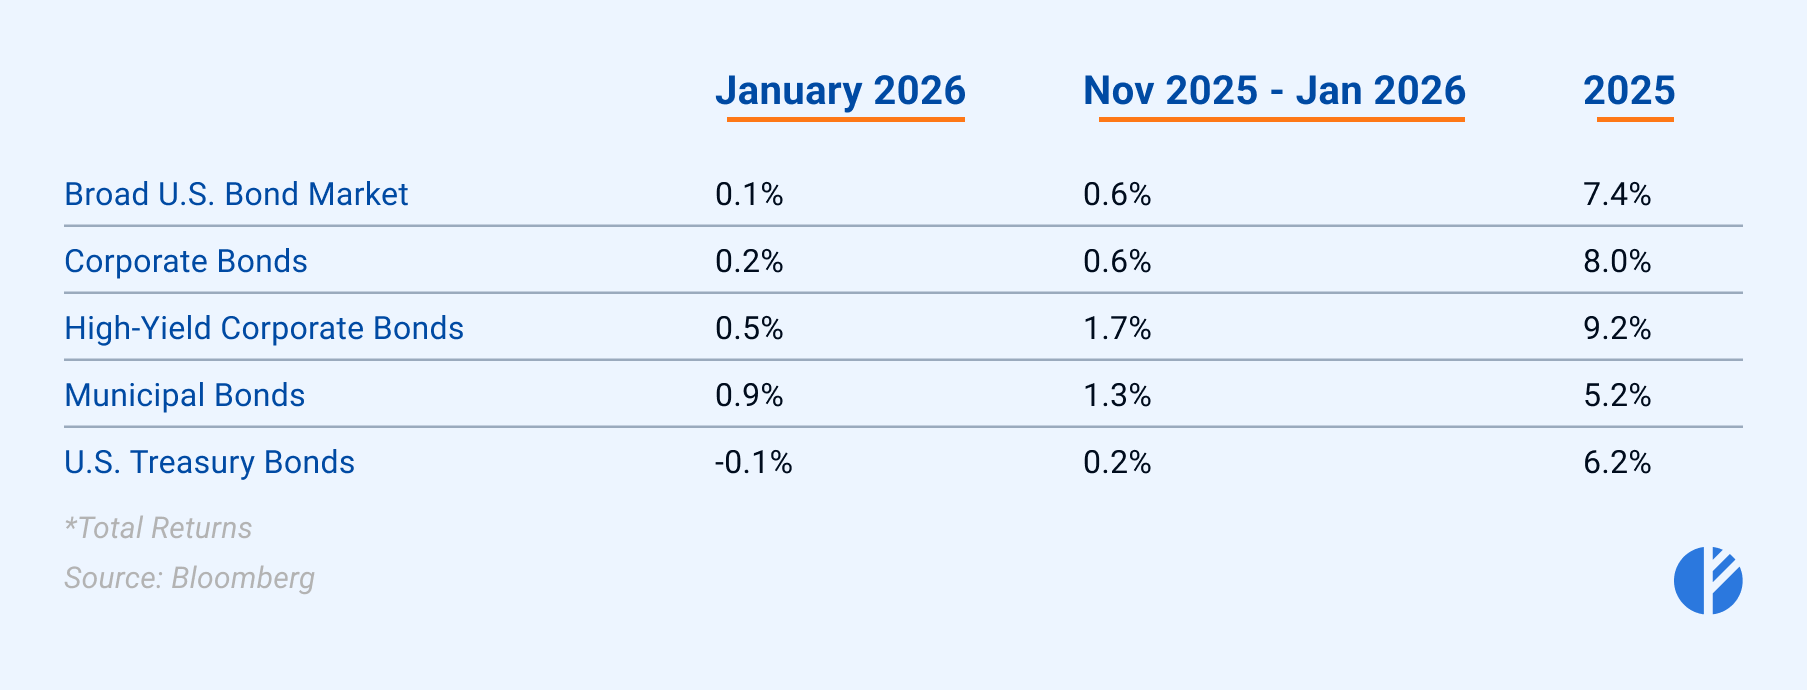
The fixed-income market produced modest but mostly positive total returns across major sectors, despite a slight uptick in Treasury yields. The broad U.S. bond market returned 0.1%, corporate bonds gained 0.2%, high-yield corporates led with 0.5%, and municipal bonds delivered the strongest performance at 0.9%, while U.S. Treasury bonds posted a loss of 0.1%.
Sentiment
VIX remained relatively stable throughout the month, spiking to 20 only one day, January 20th.
Commodities
Precious metals
Gold continued its remarkable rally in January12, propelled by geopolitical uncertainties, a weakening U.S. dollar, and sustained safe-haven demand, pushing the precious metal to a fresh all-time high surpassing $5,500 per ounce before a sharp reversal struck on January 30 – its worst single-day plunge in decades, with prices collapsing roughly 10% as investors rushed to lock in profits after the steep ascent.
Silver followed suit with an even more pronounced surge13, rising over 60% for the month to a stunning all-time high near $120–$121 per ounce by late January. However, just like gold, the rally abruptly reversed on January 30, when silver shed more than 30% in a historic single-day crash.
Crude Oil
After the downfall in 2025, crude oil staged a robust rebound in January, delivering one of its strongest monthly performances in recent years amid a confluence of geopolitical tensions and temporary supply disruptions. WTI futures surged from lows around $55–$58/bbl at year-start to multi-month highs near $65–$66/bbl.
Natural Gas
Natural gas prices skyrocketed during the second half of January
because of the Winter Storm Fern17, bringing record-breaking sub-freezing temperatures, heavy snow, ice, and widespread disruptions across the central and eastern United States.
Henry Hub futures surged from around $3–$3.50 per MMBtu early in the month to multi-year highs above $7 per MMBtu, fueled by explosive heating demand from homes, businesses, and power generation, combined with significant production freeze-offs that slashed supply.
Later, as the storm eased and temperatures moderated toward the end of January, prices retreated sharply, with futures settling around $4.30 per MMBtu on January 30th.