In June, markets showed renewed optimism, with investor confidence rising across major asset classes. A combination of strong equity performance and expectations for easier monetary conditions drove positive momentum throughout the financial landscape.
Major Headlines
The Senate passed the GENIUS Act
On June 17th,
the Senate passed the Guiding and Establishing National Innovation for US Stablecoins (GENIUS) Act1,
marking the first major federal legislation dedicated to stablecoins – digital assets pegged to the US dollar.
The Act establishes a comprehensive federal regulatory framework for the issuance and use of stablecoins, providing much-needed oversight and operational guidelines for the industry.
By paving the way for banks, fintech companies, and major retailers to issue their own stablecoins or to integrate them into existing payment platforms,
the legislation represents a significant step toward the mainstream adoption and regulation of digital assets within the US financial system. Nevertheless, the GENIUS Act is not yet law;
it must still be passed by the House of Representatives and signed by President Donald Trump before it can take effect.
U.S. – China Trade Deal
On 26-27 June, the United States and China
finalized a targeted trade framework2 aimed at de-escalating tensions and promoting cooperation in key sectors.
After intensive negotiations in London, both parties confirmed the agreement, which focuses on facilitating rare-earth mineral exports – vital for industries such as electronics, defense, and electric vehicles.
Under the terms of the deal, China will expedite the review and approval of export applications for items subject to export control regulations, effectively easing previous restrictions on rare earths.
In return, the United States has agreed to lift a range of existing trade barriers imposed on Beijing and will halt efforts to revoke the visas of Chinese students studying at U.S. colleges and universities.
Fed stress test results
The Federal Reserve’s 2025 stress test results showed that
22 major U.S. banks would remain solvent and above minimum capital thresholds3
even after absorbing an estimated $550 billion in hypothetical losses. This year’s scenario envisioned a major global recession with a 30% drop in commercial real estate prices, a 33% decline in housing prices, a 10% unemployment rate, and a 50% fall in stock prices.
While last year’s test assumed a similar unemployment rate, it featured larger declines in asset prices.
Macroeconomic Review
GDP
The Commerce Department’s third estimate shows that
U.S. GDP contracted at a –0.5% annualized rate in Q1 20254 – markedly weaker than the prior readings of –0.2% and –0.3%.
This downward revision was largely due to significantly weaker-than-expected consumer spending, which rose just 0.5% (well below the 1.2% previously reported), and a substantial drag from net exports amid a surge in imports.
Federal Reserve Policy
At its June 17–18 meeting,
the Federal Reserve kept the federal funds rate unchanged at 4.25–4.50%5, marking a fourth consecutive pause.
The Fed continued to project two rate cuts in 2025, citing reduced uncertainty surrounding the economic outlook.
In the lead-up to the meeting, several officials indicated a preference to keep rates on hold while assessing the potential impact of President Donald Trump’s economic policies on inflation and overall growth.
Inflation
According to the Federal Reserve Bank of Cleveland’s
June nowcasts6,
headline PCE inflation is estimated at 2.5% year-over-year, while core PCE – which excludes food and energy – stands at 2.7%.
For comparison, the official figures for May showed headline PCE inflation at
2.3% YoY7,
with core PCE holding steady at
2.7%8.
Manufacturing
U.S factory activity continued to contract slightly in June, though conditions showed signs of improvement.
The ISM Manufacturing PMI rose to 49.0 from 48.5 in May, the highest in four months, showing that the pace of the slowdown is easing.
Production was a bright spot, with the production index jumping to 50.3 (up 4.9 points), as companies ramped up output following earlier inventory builds.
However, demand remained weak, new orders fell to 46.4 and order backlogs dropped to 44.3, both declining for a fifth straight month.
Input costs continued to rise, with the prices paid index increasing to 69.7, while the employment index slipped to 45.0, indicating ongoing job cuts in the manufacturing sector.
Labor Market
U.S. labor market data for June painted a resilient picture, even as economic growth cooled.
According to the Bureau of Labor Statistics,
nonfarm payrolls rose by 147,0009,
outpacing earlier
estimates that had called for a more modest gain of 106,00010.
The unemployment rate actually fell to 4.1%, defying expectations for a rise to 4.3% and improving from May’s 4.2%.
While job growth has moderated from previous months—May’s payrolls rose by 139,000 – the steady pace of hiring and a lower jobless rate highlight the labor market’s underlying strength, even as the broader economy shows signs of slowing.
Cross-Asset Performance Review
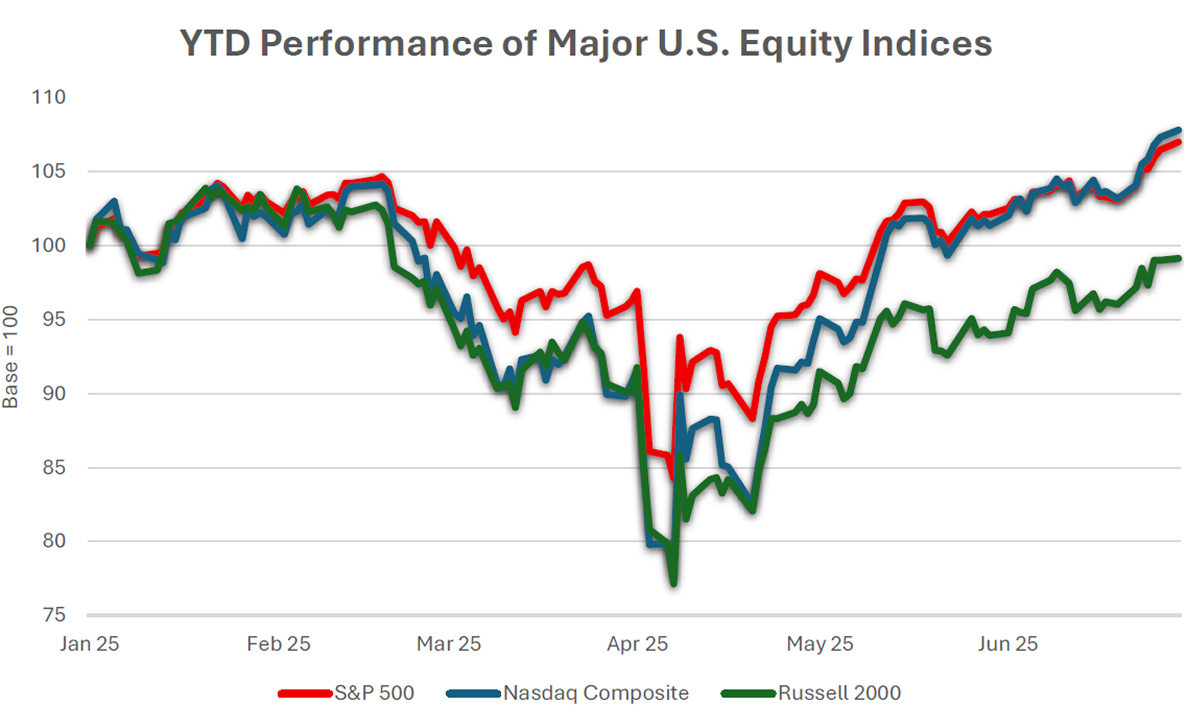
Equity Market Performance
Sector Highlights
June’s market rally revealed a clear split in sector performance, with growth-oriented segments posting strong gains while defensive sectors lagged amid evolving market conditions.
Technology led the advance, with
XLK increasing by nearly 9.4%1, driven by ongoing enthusiasm for artificial intelligence and strong earnings from major tech firms.
Communication Services also advanced, as
XLC rose close to 7%2 on the back of solid results from media and internet platforms.
The Energy sector strengthened, with
XLE up over 4%3, benefiting from stabilizing oil prices and improving demand outlook.
Industrials posted respectable gains, with
XLI rising just over 3%4,
supported more by expectations around infrastructure investment and reshoring dynamics, even as U.S. manufacturing activity remained under pressure in June.
Financials and Materials edged higher, as
XLF gained about 2.5%5 and
XLB added 1.9%6,
reflecting improved economic sentiment. Consumer Discretionary was little changed, with
XLY up less than 1%7, as higher borrowing costs and cautious consumer spending weighed on the sector.
Defensive sectors lagged behind. Health Care saw a modest gain, with
XLV up just over 1%8.
Real Estate declined, as
XLRE fell nearly 0.8%9, pressured by higher long-term yields and concerns about commercial property markets.
Utilities slipped by 0.4% (XLU)10,
and
Consumer Staples decreased 2.3% (XLP)11, as investors rotated out of traditionally defensive, interest-rate-sensitive sectors in favor of growth opportunities.
Fixed Income and Credit Markets
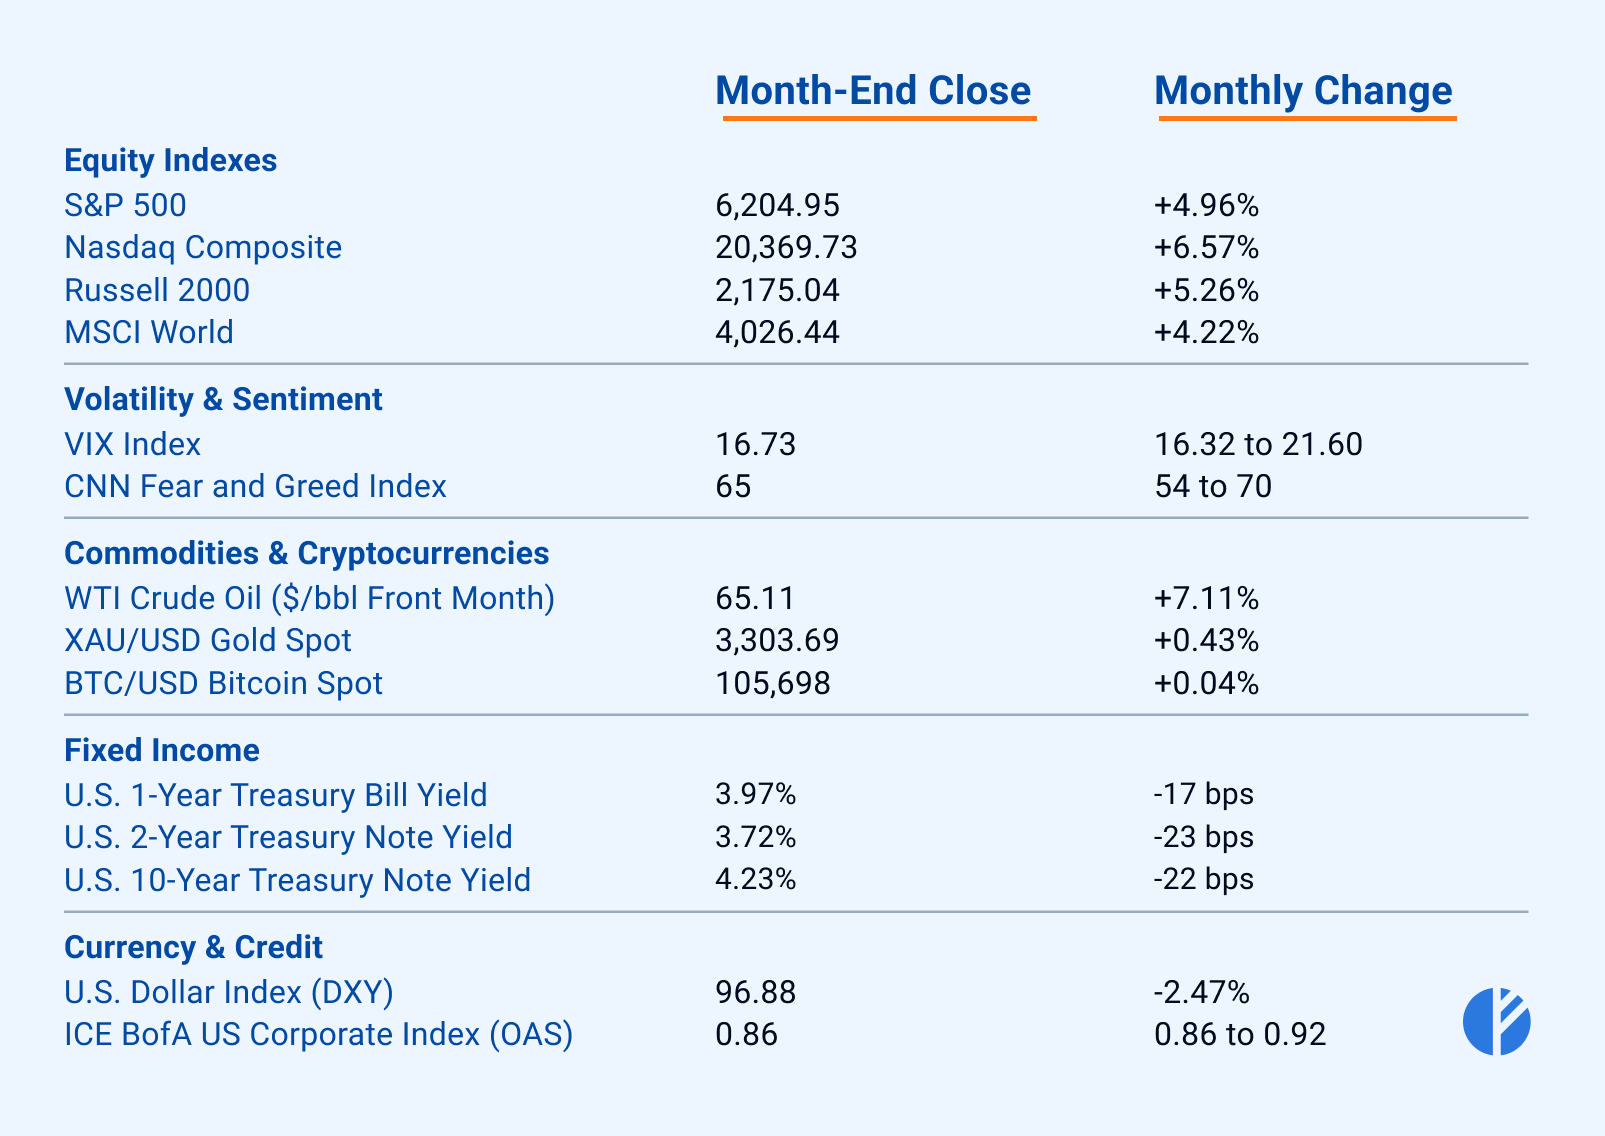
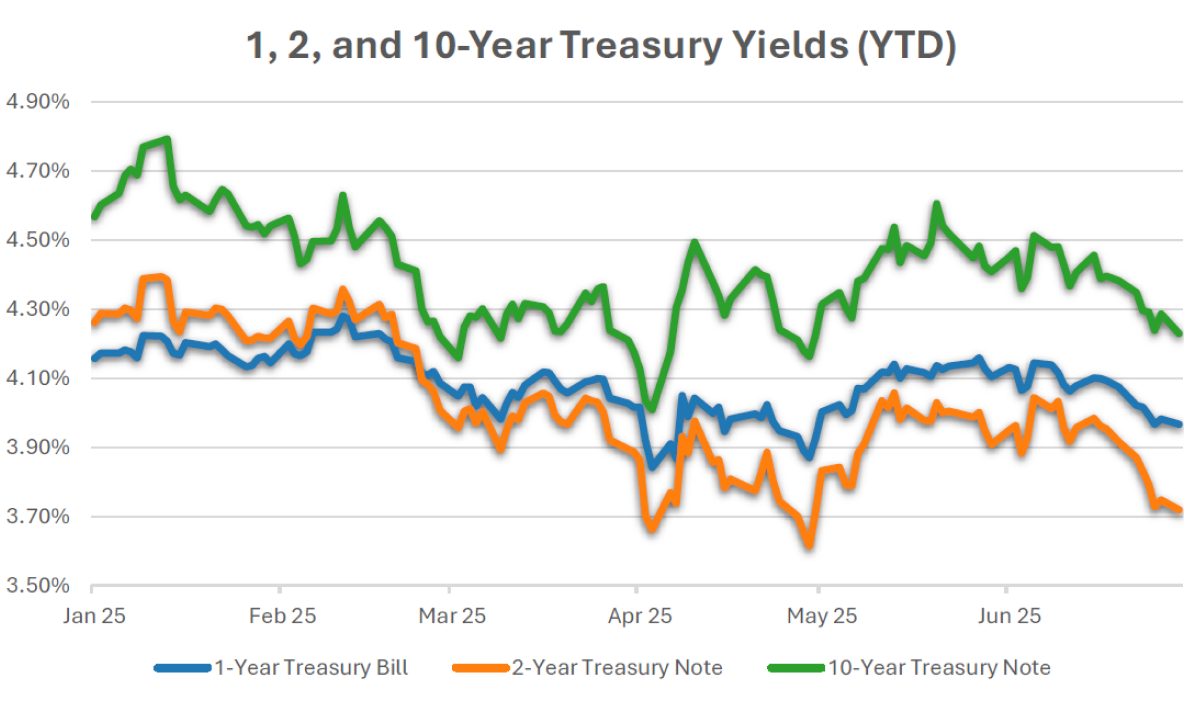
Treasury yields declined across the curve in June, with the
1-year12,
2-year13,
and
10-year yields14 dropping by 17, 23, and 22 basis points, respectively.
This decline was largely driven by growing expectations that the Federal Reserve will soon begin cutting interest rates, as softer economic data and easing inflation strengthened the case for policy easing.
Reflecting these expectations, the yield on the 2-year Treasury note dipped below that of the 1-year bill—an unusual inversion that underscores the market’s belief that rate cuts are likely within the next 6 to 12 months.
At the same time, the option-adjusted spread (OAS) of the ICE BofA US Corporate Index
remained steady between 0.87 and 0.92 throughout the month15, signaling sustained investor confidence in the corporate bond market.
Oil
Crude oil prices experienced significant volatility in June16,
with
WTI starting the month at $60.79 per barrel17 and rallying to a mid-month peak near $75 amid heightened Middle East tensions and supply concerns.
As geopolitical risks eased and OPEC+ ramped up production, prices retreated, ending the month at $65.11. Despite the late pullback, WTI still posted a 7.1% gain for June.
Currency and Volatility
DXY fell by over 2%18, from 99.33 to 96.88 over the month.
Overall, the currency index fell 10.7% in the first half of 2025 — its worst performance since 197319.
The slower economic growth, political uncertainty, and rising fiscal concerns all contribute to this slide.
Investor Sentiment
The Fear & Greed Index by CNN
fluctuated between 54 (neutral) and 66 (greed) during the month21, reflecting shifting periods of cautious optimism and stronger risk appetite among investors.
ETF of the Month
ARKK
In June, the ARK Innovation ETF (ARKK)
surged approximately 22%22, capturing significant market attention.
This actively managed fund, targets companies at the forefront of disruptive innovation – ranging from artificial intelligence and biotechnology to robotics and other transformative technologies.
The fund’s standout performance was driven by a powerful rally across its high-growth holdings, with
seven of ARKK’s top ten positions posted monthly gains of more than 10%23.
Key catalysts included renewed momentum in artificial intelligence, sustained investor demand for innovative tech, and the landmark passage of the GENIUS Act24, which brought long-awaited regulatory clarity to the digital asset sector.
Coinbase (8.3% of the portfolio)
soared more than 46%25,
while Circle (4.6% of the portfolio)
delivered an extraordinary post-IPO surge26, ending June at $181.29 – an increase of nearly 485% from its early-month IPO price of $31.
Aerospace & Defence Sector ETFs
As governments worldwide intensify their focus on security and strategic readiness, global defense spending is climbing to record highs.
Reflecting this trend, President Trump has proposed a $1 trillion U.S. national defense budget for fiscal year 2026 – an increase of 13% from FY 2025.
These dynamics drove robust gains among major U.S.-listed aerospace and defense ETFs in June: the SPDR S&P Aerospace & Defense ETF (XAR)
surged 10.3%27, the iShares U.S.
Aerospace & Defense ETF (ITA)
rose 6.4%28,
the Invesco Aerospace & Defense ETF (PPA)
advanced 6.2%29, and the FT Cboe Vest U.S. Equity Enhance & Moderate Buffer ETF – Shield (SHLD)
gained 5.6%30.
PPLT
Last month,
platinum staged a remarkable rally31, with prices soaring more than 25% to reach their highest level since 2014.
This surge was likely driven by a deepening supply deficit in the platinum market, coupled with rising investor demand for alternative precious metals.
Reflecting these dynamics, the Aberdeen Standard Physical Platinum Shares ETF (PPLT) – one of the most widely recognized funds backed by physical platinum –
jumped 27% in June32.
Uranium ETFs
The uranium sector extended its rally33, bolstered by increased U.S.
domestic enrichment capacity, streamlined regulations, accelerated licensing for nuclear reactors, and sustained trade restrictions targeting major nuclear fuel exporters.
These developments enhanced investor optimism about long-term demand and supply fundamentals, fueling substantial gains in uranium-focused ETFs.
Notably, the Global X Uranium ETF (URA)
jumped 21%34,
while the Sprott Uranium Miners ETF (URNM)
climbed 19%35 in June.
Investment Outlook
With current market conditions defined by equity indices rallying to new all-time highs – fueled by strong tech sector performance, robust investor enthusiasm for AI-driven innovation following the passage of the GENIUS Act, and rising expectations of Federal Reserve rate cuts – the following instruments may be considered by investors seeking to capitalize on these ongoing trends:
- Growth-tilted ETFs: Growth-focused ETFs that track technology and communication services remain attractive amid record-setting gains in the S&P 500 and Nasdaq. The rally is underpinned by continued enthusiasm for artificial intelligence, with companies like Nvidia and other AI leaders driving momentum.
- Intermediate-to-long Treasury instruments: Treasury securities with intermediate to long durations are well-positioned as markets begin to price in expected Fed rate cuts later in the year, offering both defensive value and the potential for capital appreciation if yields decline further.
- Short-term Treasuries: Treasury bills and other front-end U.S. government securities’ yields are still elevated, giving investors a highly liquid, virtually risk-free place to park cash while awaiting clearer guidance on Fed policy. With rate cuts likely only later in the year, the bill curve remains attractive relative to longer maturities, allowing investors to lock in positive real returns without taking on duration or credit risk.
- Institutional Crypto: Regulated digital asset platforms are poised to benefit from the GENIUS Act, which has enhanced institutional confidence and paved the way for greater integration of blockchain technology within the traditional financial system.
Imperial Fund Asset Management is a SEC-registered investment adviser.
SEC registration does not imply a certain level of skill or training.
The information provided is for informational purposes only and should not be considered investment advice or a solicitation to buy or sell any securities.
All investments involve risk, including the possible loss of principal. Please review our
full disclaimer for additional information.