In July, financial markets navigated a challenging mix of rising Treasury yields, muted job growth, and persistent uncertainty around the Federal Reserve’s next moves.
Despite positive headlines from major trade agreements and fiscal legislation, softer labor data and ongoing weakness in manufacturing tempered investor optimism.
Gains in equities became more selective, with Technology, Industrials and Utility sectors standing out as key drivers of performance.
Major Headlines
One Big Beautiful Bill Passed
On July 4th,
the One Big Beautiful Bill Act was signed1,
a legislative package that permanently extends key provisions of the Tax Cuts and Jobs Act, increases infrastructure, defense, and energy funding, and raises the debt ceiling by $5 trillion.
The Congressional Budget Office projects the law will add about $3.3 trillion to federal deficit over the next 10 years.
Economists forecast
it could boost long-run GDP by 0.8% while reducing federal tax revenue by roughly $4 trillion over the same period2.
U.S. – Japan Trade Deal Announced
On July 23, 2025,
the United States and Japan announced a landmark trade agreement3 that reduces certain longstanding tariffs and establishes a framework for significant Japanese investment in the U.S.
Under the deal, tariffs on Japanese goods were lowered to 15%. Japan committed to a $550 billion package of loans, guarantees, and investment financing, primarily targeting U.S. sectors such as semiconductors and clean energy.
U.S. – EU Trade Framework Finalized
On July 27, 2025,
the United States and the European Union announced a trade agreement4, aiming to reset the transatlantic economic partnership after months of tariff threats and rising tensions.
Under the deal, a uniform 15% U.S. tariff will apply to nearly all EU imports. In return, the EU has pledged to purchase $750 billion worth of American energy and invest $600 billion into U.S.
industry and supply chains by 2028, with a further commitment to increase
defense procurement from U.S. firms5.
While tariffs on EU steel and aluminum will remain at 50% for now, both sides agreed to revisit these rates by year-end.
Macroeconomic Review
GDP
The U.S. economy rebounded sharply with
an annualized growth of 3% in Q2 20256 following a 0.5% contraction in Q1 and beating the expectations of a 2.4% rise.
The turnaround was largely fueled by a 30.3% plunge in imports after a series of tariff announcements, compared to a surge of 37.9% in Q1.
Federal Reserve Policy
At its July 30 FOMC meeting,
the Federal Reserve kept interest rates unchanged at 4.25%–4.50%7, extending its “wait and see” approach in response to ongoing economic uncertainty.
Many economists now expect the Fed to start cutting rates at its next meeting on September 16–17, although the overall outlook remains uncertain.
Inflation
According to the Federal Reserve Bank of Cleveland’s July nowcasts8, headline PCE inflation is projected at 2.6% year-over-year, with core PCE (excluding food and energy) estimated at 2.9%.
For comparison,
the actual figures9 for June were 2.6% for headline PCE and 2.8% for core PCE.
Manufacturing
U.S. factory activity remained in contraction during July10, as the ISM Manufacturing PMI slipped to 48.0 from 49.0 in June, marking the fifth consecutive month below the expansion threshold.
Although production showed a modest rebound, rising to 51.4 from 50.3, new orders stayed in contraction territory for a sixth straight month at 47.1.
The employment index dropped sharply to 43.4 – its lowest level since 2020 – reflecting muted demand and ongoing tariff-related uncertainty.
Input costs remained elevated, with the prices index easing to 64.8 from June’s 69.7, but still indicating considerable inflationary pressure across the sector.
Labor Market
U.S. job growth in July was significantly below expectations11, with just 73,000 new jobs added – far short of the 115,000 forecasted by economists.
The unemployment rate also edged up to 4.2% from 4.1% in June.
On August 1st,
the Bureau of Labor Statistics released major downward revisions for May and June12: job gains for May were cut from 144,000 to just 19,000, while June’s total was lowered from 147,000 to only 14,000. In total, these revisions erased 258,000 jobs from previous estimates.
Cross-Asset Performance Review
Equity Market Performance
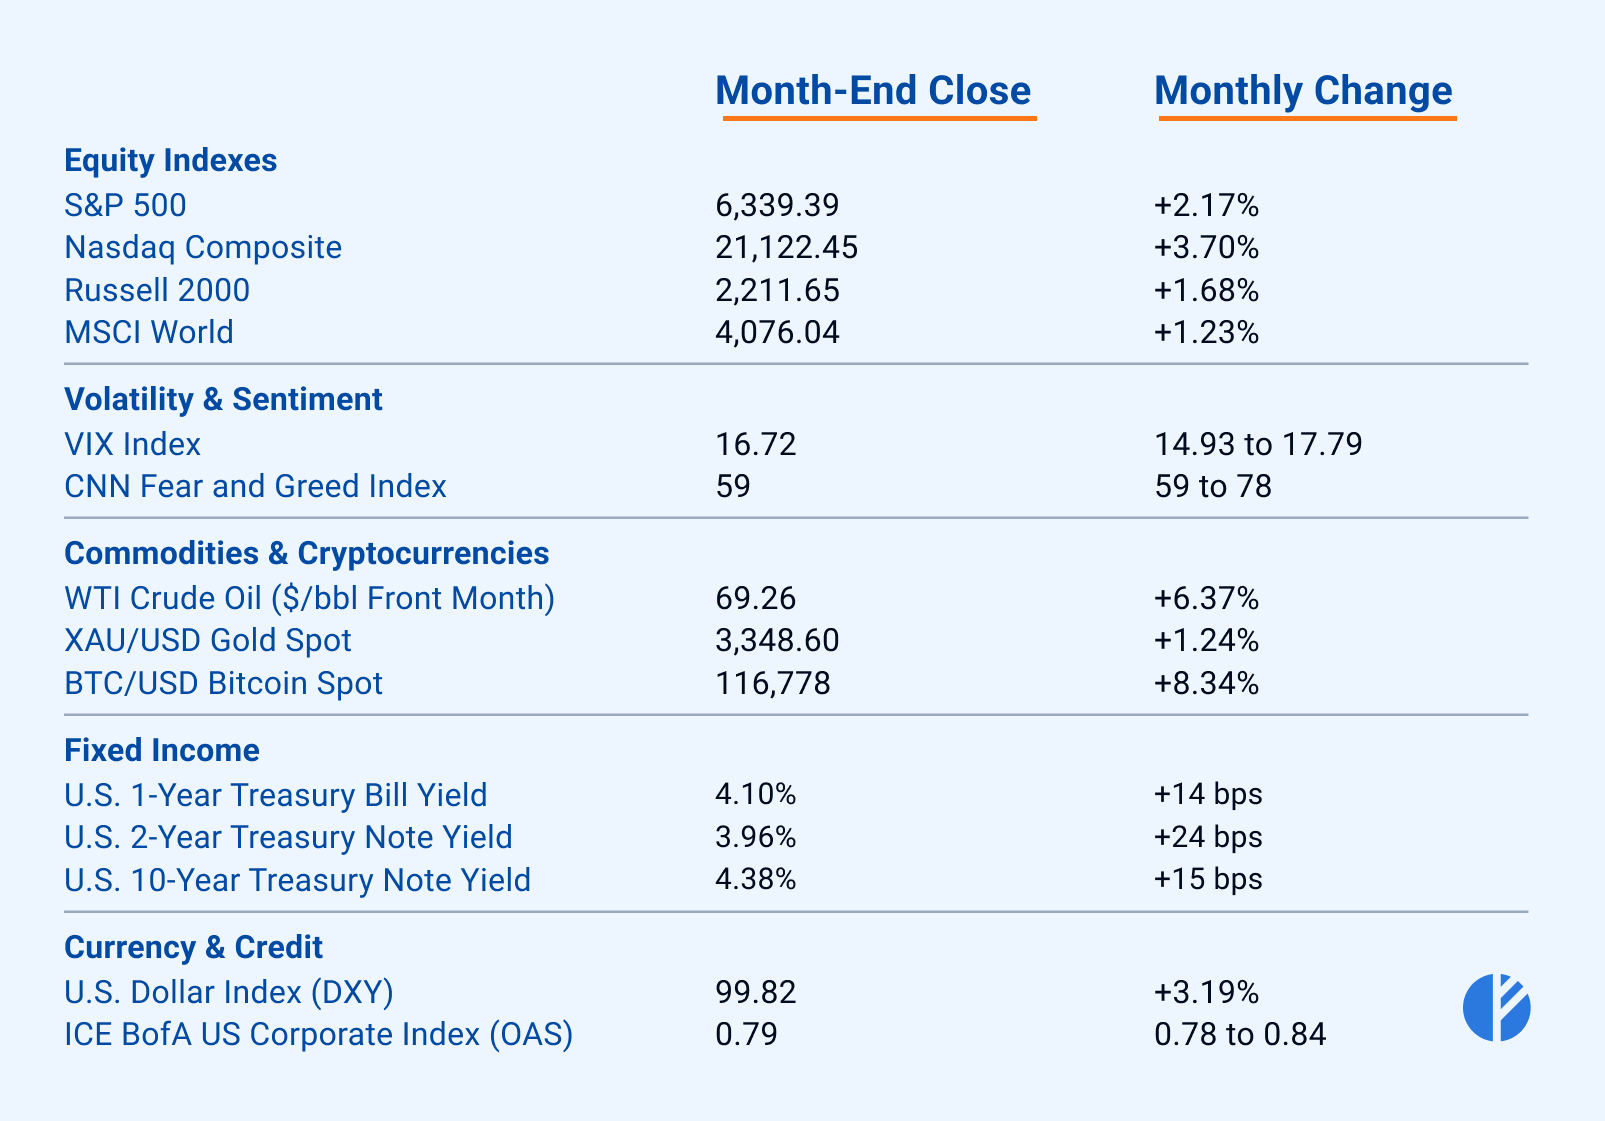
All major U.S. equity indices delivered steady gains in July all growing by around 2-3%.
The S&P 500 climbed 2.17%13,
while the tech-heavy Nasdaq Composite outperformed with a
3.70% advance14.
The Russell 2000, which tracks U.S. small-cap stocks,
rose 1.68% in July15.
Developed markets also participated in the rally, as the MSCI World Index
rose by 1.23%16 for the month.
Sector Highlights
The Utilities sector
led the July’s performance charts17, with
the XLU gaining 4.9%18.
Surging power demand from AI-driven data centers – combined with supportive government policy and a fresh wave of infrastructure investment – has reinforced the industry’s growth.
The Technology sector also delivered strong results, with
XLK rising 3.8% on the back of strong19 Q2 megacap earnings and persistent momentum in AI and cloud computing.
Industrials also moved higher,
with XLI gaining 3%20,
supported by21 resilient earnings, steady capacity utilization, and the largest volume of commercial and industrial loans since 2020.
The Energy and Consumer Discretionary sectors registered gains as well, with XLE and XLY up 2.8% and 1.9%, respectively.
Energy rose on an oil price overall good performance during the
peak driving season22,
while stronger consumer confidence and
growth in retail sector23 contributed to the Consumer Discretionary sector.
The Financials and Real Estate sectors opened July on solid note, buoyed by optimism ahead of Q2 bank earnings and expectations of a possible Fed rate cut in September.
The Financials ETF (XLF) climbed as much as 2.04 %24,
while
the Real Estate ETF (XLRE) peaked at 3.45 %25,
helped by a temporary dip in mortgage rates26 that spurred lending and property activity.
Late in the month, however,
the Fed adopted a more cautious stance27,
offering no indication of a September rate cut and stressing the need for additional data before considering policy easing.
This shift likely contributed to the sector’s reversal, with both XLF and XLRE giving back earlier gains and ending the month near flat.
Materials stocks initially rallied on optimism that
new infrastructure spending and government investment commitments28 would boost demand for raw materials,
with the Materials sector ETF (XLB)
surging as much as 5.19% at its July peak29.
However, rising bond yields later in the month pushed up funding costs and dampened economic growth expectations, which weighed on sentiment and erased most of the sector’s gains. By month-end, XLB had pulled back to finish roughly flat, giving up its earlier advance.
Fixed Income and Credit Markets
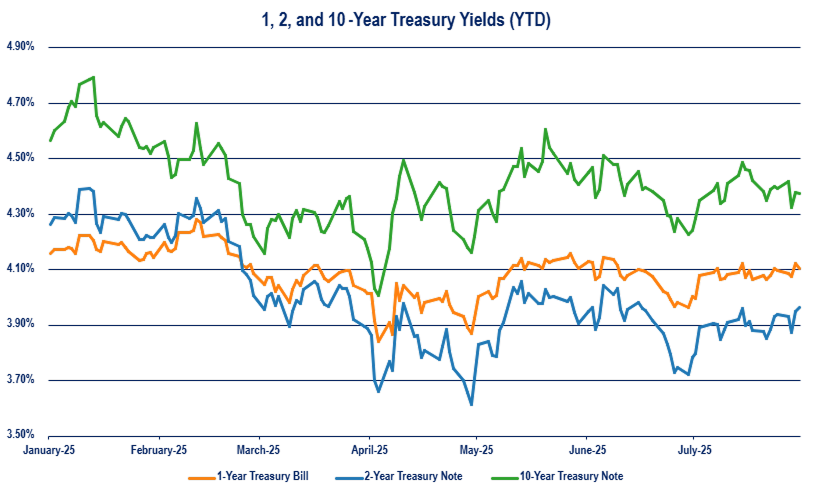
Treasury yields moved higher across all maturities in July, with the
1-year35,
2-year36, and
10-year yields37 rising by 14, 24, and 15 basis points.
Among the drivers were
uncertainty about a Fed rate cut in September38 and
June inflation that proved to be the highest in five months39.
At the same time, the option-adjusted spread (OAS) of the ICE BofA US Corporate Index
dropped slightly40 remaining between 0.78 and 0.84 throughout the month,
signaling improved investor confidence in the corporate bond market.
US Dollar
DXY
bounced back modestly in July41, rising by over 3% from 96.88 to 99.82.
Especially great rally happened in the past days of July, when the index surged by 2.7% over just five days, its best five-day streak since 2022.
The uncertainty around soon interest rate cuts,
EU-U.S. trade deal outcome42 are likely to be the main drivers of the rally.
Volatility and Investor Sentiment
Market volatility, as measured by VIX,
slightly fell43, fluctuating in a range of 15 to 18 throughout the month, indicating a rather low level of volatility.
The CNN Fear & Greed Index fluctuated between 59 and 78 during July44, moving firmly into the "greed" and "extreme greed" sentiments - indicating growing investor confidence.
ETF of the Month
Ethereum stood out as a top performer in July45, surging approximately 49%.
The sharpest gains came during a two-week rally in mid-July, the strongest run since 2020.
Driven by the passage of the GENIUS Act, which delivered a major regulatory tailwind to the crypto sector.
Momentum accelerated further when BlackRock filed with the SEC on July 17 to introduce staking to its ETHA Ethereum ETF, underscoring the deepening institutional interest in Ethereum.
Imperial Fund Asset Management is a SEC-registered investment adviser.
SEC registration does not imply a certain level of skill or training.
The information provided is for informational purposes only and should not be considered investment advice or a solicitation to buy or sell any securities.
All investments involve risk, including the possible loss of principal. Please review our
full disclaimer for additional information.